
Zanwei Yang, Liangliang Zheng, Yong Wu, Hongsong Qu. An Improved Moment Matching Algorithm for Non-Uniform Correction of Hyperspectral Images[J]. Laser & Optoelectronics Progress, 2020, 57(8): 082801
- Laser & Optoelectronics Progress
- Vol. 57, Issue 8, 082801 (2020)
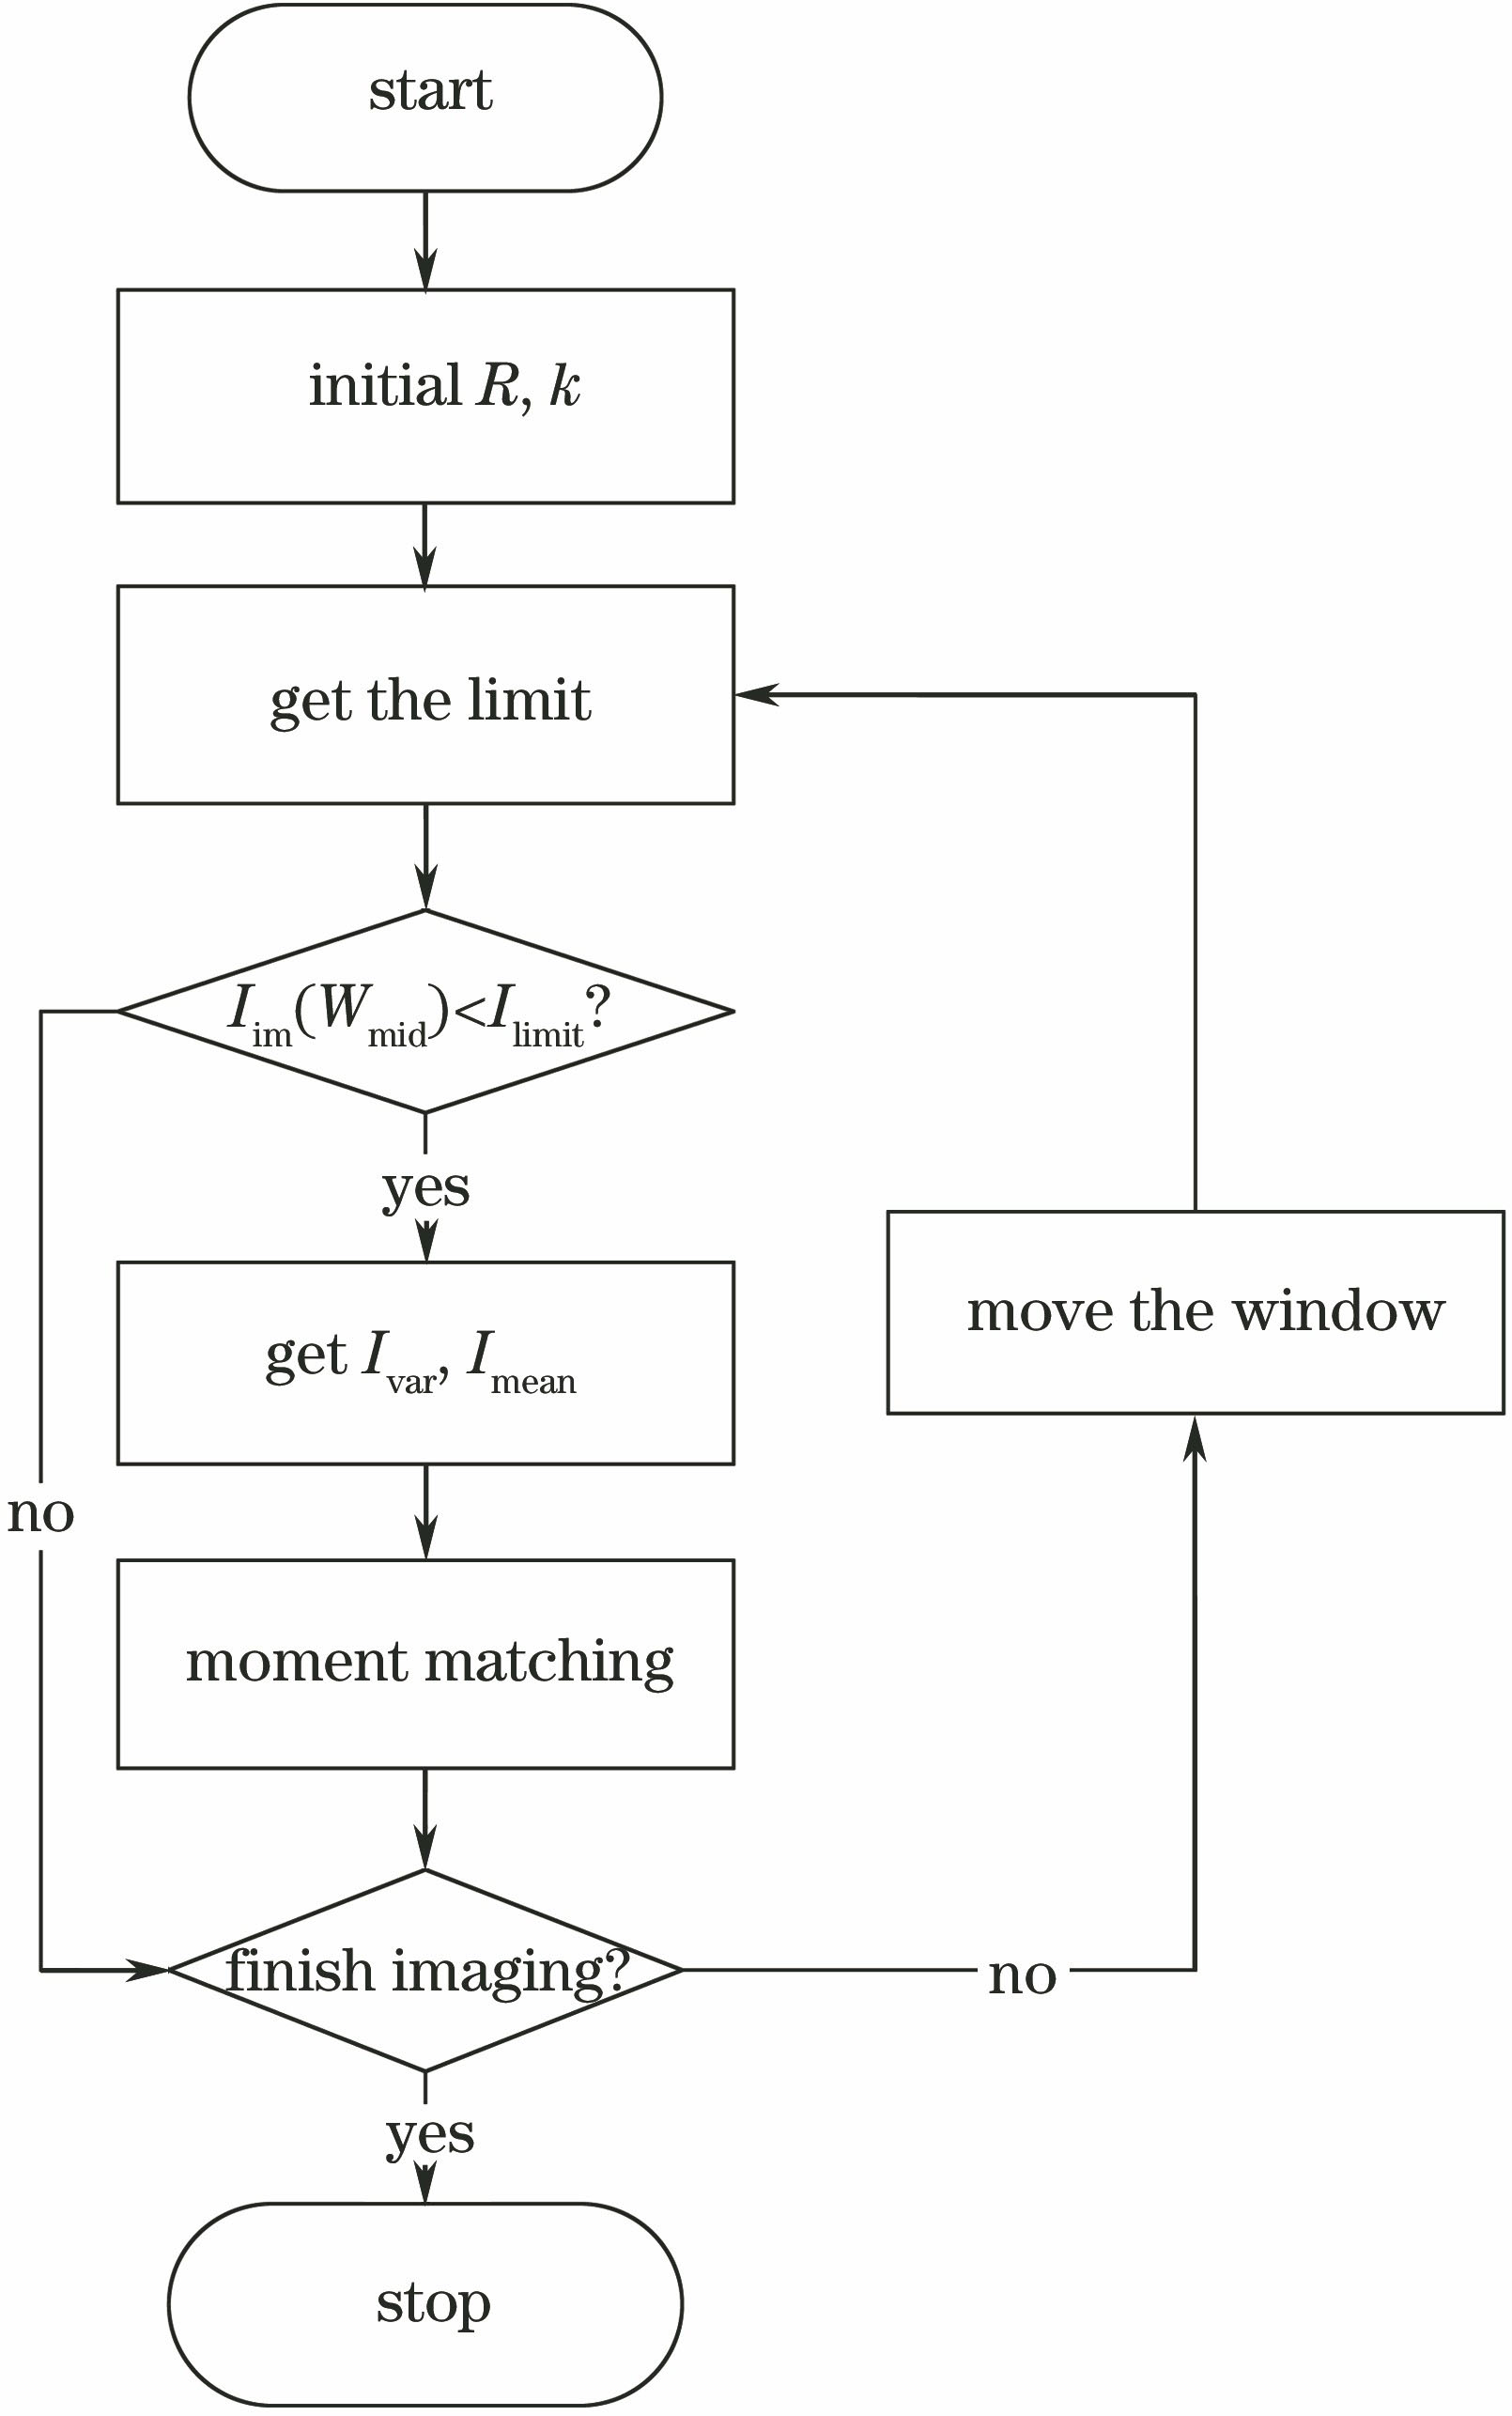
Fig. 1. Flow chart of improved moment matching non-uniformity correction algorithm
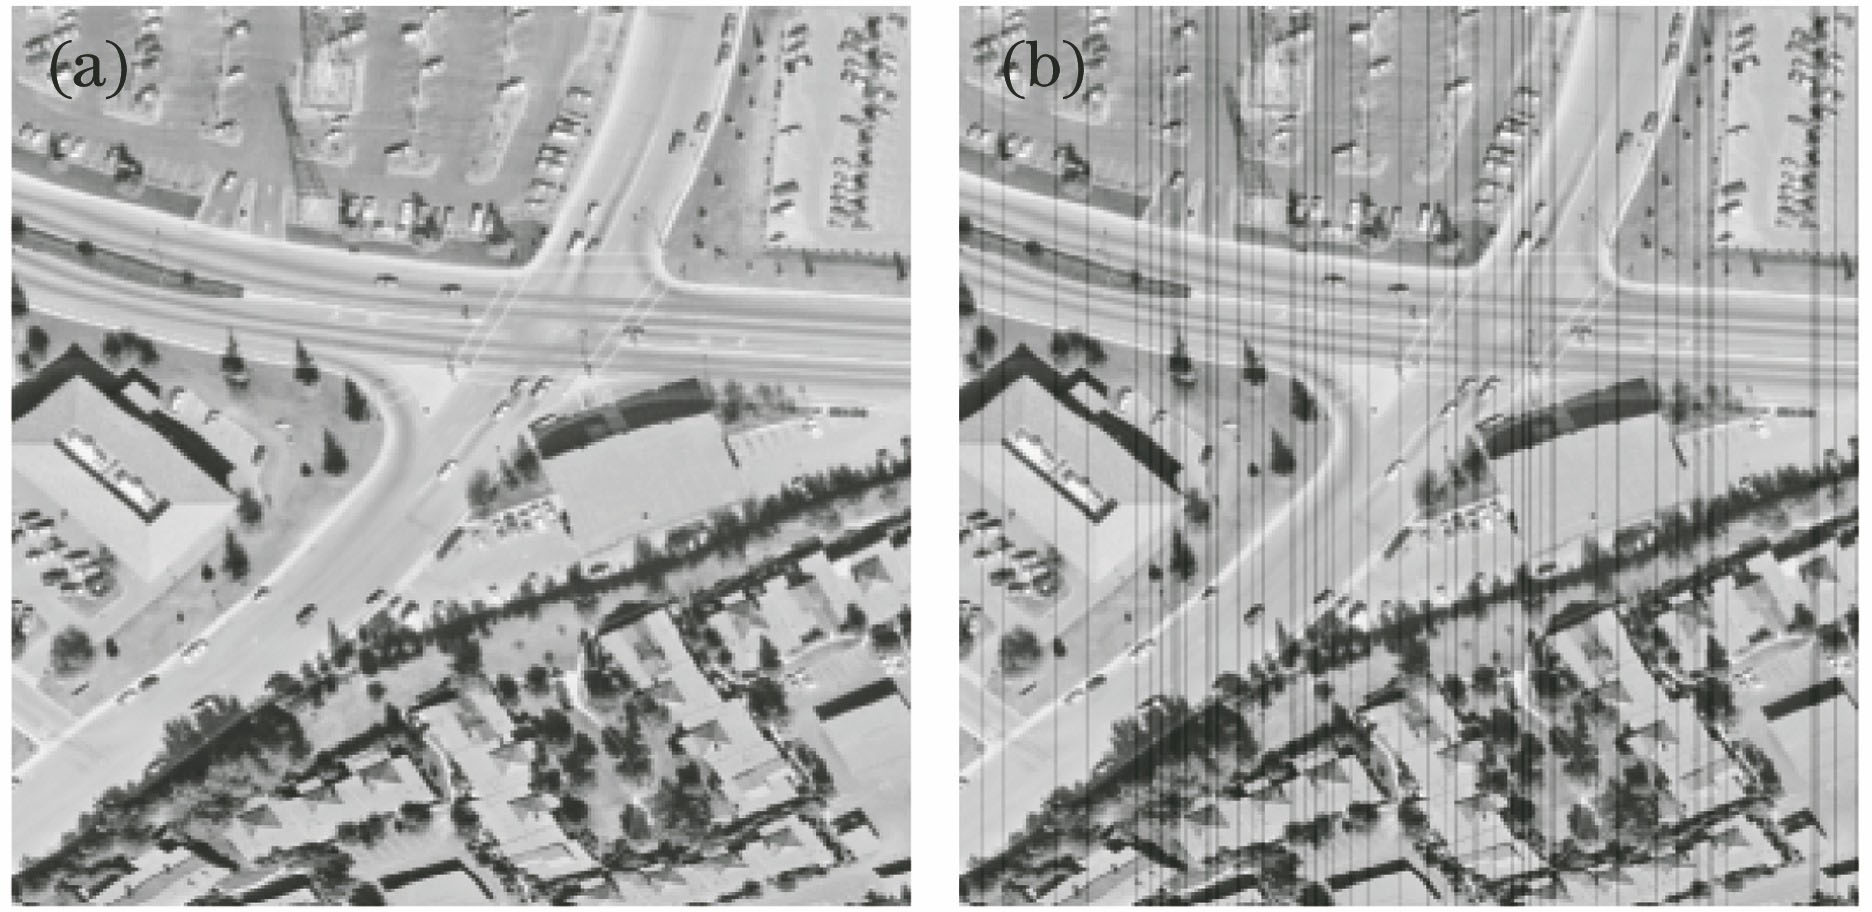
Fig. 2. Simulated images. (a) Original image; (b) image with stripe noise
Fig. 3. Destriped results of simulated image in Fig. 2 (b) by different methods. (a) BW; (b) WMM; (c) DSLFRI; (d) HM; (e) proposed method
Fig. 4. Gray mean values of simulated image in column.(a)Original image;(b) image with stripe noise
Fig. 5. Gray mean values of destriped results in column by different methods. (a) BW; (b) WMM; (c) DSLFRI; (d) HM; (e) proposed method
Fig. 6. Destriped results of hyperspectral image of band 25 by different methods. (a) Original image; (b)BW; (c) WMM; (d) DSLFRI; (e) HM; (f) proposed method
Fig. 7. Destriped results of hyperspectral image of band 27 by different methods. (a) Original image; (b) BW; (c) WMM; (d) DSLFRI; (e) HM; (f) proposed method
Fig. 8. Gray mean scale of destriped results of hyperspectral image of band 25 by different methods. (a) Original image; (b) BW; (c) WMM; (d) DSLFRI; (e) HM; (f) proposed method
Fig. 9. Gray mean values of destriped results of hyperspectral image of band 27 by different methods. (a) Original image; (b) BW; (c) WMM; (d) DSLFRI; (e) HM; (f) proposed method
|
Table 1. Comparison of assessment criteria for simulated image in Fig. 2 (b)
|
Table 2. Comparison of objective indexes for simulated images with different noises
|
Table 3. Comparison of objective indexes for hyperspectral image of band 25
|
Table 4. Comparison of objective indexes for hyperspectral image of band 27

Set citation alerts for the article
Please enter your email address
© Copyright 2018-2021 | Chinese Laser Press. All Rights Reserved 沪ICP备15018463号-20