• Spectroscopy and Spectral Analysis
  • Vol. 40, Issue 11, 3579 (2020)
Chao YANG1、1, Zhen ZHU1、1、*, Jing LI1、1, Yun-heng SUN1、1, Xue-yan OUYANG1、1, Jia-wei WANG1、1, Qian HUANG1、1, Gang DING1、1, Yao-sheng WANG1、1, and Feng JIANG1、1
Author Affiliations
  • 1[in Chinese]
  • 11. Translational Institute for Cancer Pain, Xinhua Hospital Chongming Branch, Shanghai 202150, China
  • show less
    DOI: 10.3964/j.issn.1000-0593(2020)11-3579-06 Cite this Article
    Chao YANG, Zhen ZHU, Jing LI, Yun-heng SUN, Xue-yan OUYANG, Jia-wei WANG, Qian HUANG, Gang DING, Yao-sheng WANG, Feng JIANG. Changes of Tumor Cell Components Induced by Pain-Related Neuropeptides SP Investigated by Synchrotron Radiation Infrared Microscopic Imaging Technology[J]. Spectroscopy and Spectral Analysis, 2020, 40(11): 3579 Copy Citation Text show less
    FTIR spectra of four cell lines
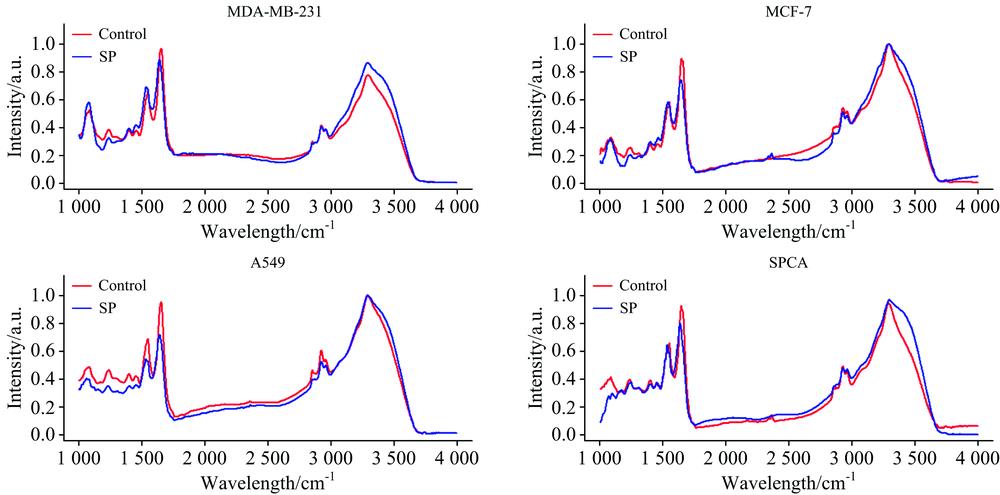
    Fig. 1. FTIR spectra of four cell lines
    Range
    /cm-1
    Peak
    position/cm-1
    Possible resolve
    990~1 0401 029C—O—, C—O—H
    1 040~1 0701 054C—O stretching
    1 070~1 0901 083P=O stretching
    1 150~1 1901 165C—O stretching
    1 230~1 2501 240P=O stretching
    1 430~1 4701 455—CH2 deformation
    1 500~1 6001 551Amide Ⅱ
    1 600~1 7001 655Amide Ⅰ
    1 700~1 8001 747C=O stretching
    2 910~2 9502 930C—H stretching
    2 950~2 9902 970
    3 300~3 5003 383O—H, N—H stretching
    Table 1. The bands frequencies assigned for the IR spectra
    MDA-MB-231(Mean±SD)P-valueMCF-7(Mean±SD)P-value
    Control(n=12)SP(n=12)Control(n=12)SP(n=12)
    Range
    /cm-1
    1 070~1 0901 076.69±6.561 077.241±4.5720.8541 079.764±2.191 078.05±2.0250.082
    1 230~1 2501 235.383±2.9161 234.832±6.1710.8481 237.656±4.9171 237.656±7.7660.51
    1 380~1 4201 396.005±2.0621 397.934±4.6480.1341 396.763±3.381 395.316±4.250.272
    1 430~1 4701 452.760±4.9441 453.587±5.0680.7321 459.441±7.9681 460.405±4.6960.401
    1 500~1 6001 548.086±0.9411 538.719±1.712<0.0011 547.432±3.0821 538.03±4.250.002
    1 600~1 7001 651.678±4.7051 639.555±3.4190.0011 647.235±4.4261 636.869±3.391<0.001
    2 910~2 9502 925.311±4.1212 925.247±4.1810.92 925.632±1.8972 924.347±0.9960.209
    2 950~2 9902 959.244±1.5172 959.244±2.1870.9992 958.418±1.6042 958.9±0.8930.241
    3 300~3 5003 295.366±1.8343 295.488±2.3960.9293 292.542±1.9963 292.059±5.6460.417
    Table 2. Spectral peak analysis of breast cancer cell lines
    MDA-MB-231(Mean±SD)P-valueMCF-7(Mean±SD)P-value
    Control(n=12)SP(n=12)Control(n=12)SP(n=12)
    Range
    /cm-1
    1 070~1 0900.52±0.1290.581±0.1820.4150.33±0.070.32±0.0870.838
    1 230~1 2500.382±0.0880.324±0.1660.7050.257±0.0860.204±0.0680.262
    1 380~1 4200.381±0.0840.394±0.1210.5160.278±0.0720.299±0.0740.632
    1 430~1 4700.377±0.0820.416±0.110.2550.282±0.0610.328±0.0740.284
    1 500~1 6000.663±0.0730.691±0.0950.290.588±0.0650.583±0.0950.917
    1 600~1 7000.965±0.0570.886±0.1010.2740.896±0.0760.739±0.1340.058
    2 910~2 9500.417±0.0570.406±0.0560.7880.54±0.0450.511±0.020.158
    2 950~2 9900.386±0.0740.388±0.0490.9550.515±0.0510.485±0.0180.182
    3 300~3 5000.775±0.1630.862±0.1180.4970.999±0.0010.996±0.0020.015
    Table 3. Statistical analysis of spectral peak of breast cancer cell lines
    A549(Mean±SD)P-valueSPCA(Mean±SD)P-value
    Control(n=12)SP(n=12)Control(n=12)SP(n=12)
    Range
    /cm-1
    1 070~1 0901 082.166±2.1721 079.121±2.7130.0211 081.871±4.4211 080.996±5.5350.468
    1 230~1 2501 235.728±3.2191 231.871±3.0490.0181 232.353±3.9931 232.835±4.5810.516
    1 380~1 4201 397.004±1.7671 398.209±3.5710.3291 397.004±3.0821 397.486±3.4090.626
    1 430~1 4701 451.245±2.3051 453.655±5.7160.381 451.486±3.4091 450.796±1.7670.782
    1 500~1 6001 545.021±4.9911 534.655±5.8990.0011 546.468±3.7791 535.619±3.0490.001
    1 600~1 7001 651.092±3.7791 637.351±8.117<0.0011 645.065±4.1231 638.074±10.2540.023
    2 910~2 9502 924.186±1.3642 924.347±1.5750.9992 925.186±1.4382 925.081±0.9410.356
    2 950~2 9902 958.659±0.6822 959.141±0.9980.3512 958.659±0.6822 958.9±0.8930.351
    3 300~3 5003 292.783±2.2913 293.747±4.3050.5633 294.153±2.5693 293.372±3.4040.683
    Table 4. Spectral peak analysis of lung cancer cell lines
    A549(Mean±SD)P-valueSPCA(Mean±SD)P-value
    Control(n=12)SP(n=12)Control(n=12)SP(n=12)
    Range
    /cm-1
    1 070~1 0900.486±0.170.396±0.3420.0750.415±0.2560.297±0.1330.468
    1 230~1 2500.463±0.1210.349±0.2830.1760.391±0.1020.377±0.1270.505
    1 380~1 4200.433±0.1140.346±0.240.8390.388±0.0980.361±0.1290.095
    1 430~1 4700.419±0.1150.356±0.0890.570.369±0.0780.375±0.110.427
    1 500~1 6000.687±0.0590.539±0.209<0.0010.656±0.0830.644±0.1530.583
    1 600~1 7000.951±0.0180.714±0.267<0.0010.922±0.0770.798±0.1080.018
    2 910~2 9500.604±0.1020.524±0.1450.2040.491±0.0580.473±0.0390.064
    2 950~2 9900.537±0.0880.495±0.1340.3420.453±0.0870.465±0.0160.305
    3 300~3 5000.993±0.0060.997±0.0030.1860.94±0.0560.966±0.030.358
    Table 5. Statistical analysis of spectral peak of lung cancer cell lines
    Chao YANG, Zhen ZHU, Jing LI, Yun-heng SUN, Xue-yan OUYANG, Jia-wei WANG, Qian HUANG, Gang DING, Yao-sheng WANG, Feng JIANG. Changes of Tumor Cell Components Induced by Pain-Related Neuropeptides SP Investigated by Synchrotron Radiation Infrared Microscopic Imaging Technology[J]. Spectroscopy and Spectral Analysis, 2020, 40(11): 3579
    Download Citation