• Spectroscopy and Spectral Analysis
  • Vol. 42, Issue 4, 1270 (2022)
Sheng-ming WANG1、*, Tao WANG1、1; *;, Sheng-jin TANG2、2;, and Yan-zhao SU1、1;
Author Affiliations
  • 11. Combat Support Academy, Rocket Force University of Engineering, Xi’an 710025, China
  • 22. Missile Engineering Academy, Rocket Force University of Engineering, Xi’an 710025, China
  • show less
    DOI: 10.3964/j.issn.1000-0593(2022)04-1270-08 Cite this Article
    Sheng-ming WANG, Tao WANG, Sheng-jin TANG, Yan-zhao SU. Hyperspectral Anomaly Detection Based on 3D Convolutional Autoencoder Network[J]. Spectroscopy and Spectral Analysis, 2022, 42(4): 1270 Copy Citation Text show less
    Comparing 2D convolution operation (a) and 3D convolution operation (b)
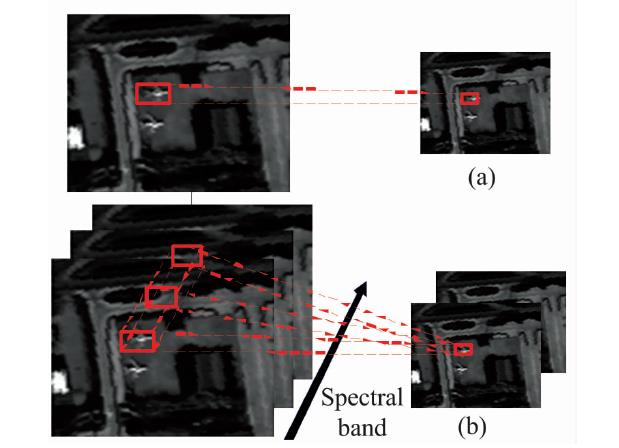
    Fig. 1. Comparing 2D convolution operation (a) and 3D convolution operation (b)
    3D convolution
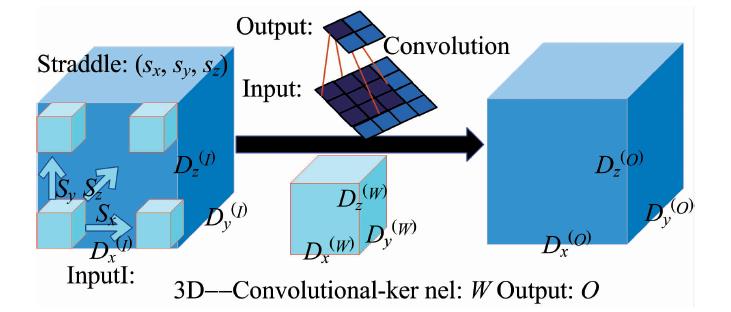
    Fig. 2. 3D convolution
    Unsupervised anomaly detection framework based on 3D-CAE
    Fig. 3. Unsupervised anomaly detection framework based on 3D-CAE
    Results of San Diego datasets anomaly detection(a): False color image; (b): Reference map; (c): RX; (d): SRX; (e): CRD; (f): UNRS; (g): LRASR; (h): 3D-CAEAD
    Fig. 4. Results of San Diego datasets anomaly detection
    (a): False color image; (b): Reference map; (c): RX; (d): SRX; (e): CRD; (f): UNRS; (g): LRASR; (h): 3D-CAEAD
    Results of Los Angeles datasets anomaly detection(a): False color image; (b): Reference map; (c): RX; (d): SRX; (e): CRD; (f): UNRS; (g): LRASR; (h): 3D-CAEAD
    Fig. 5. Results of Los Angeles datasets anomaly detection
    (a): False color image; (b): Reference map; (c): RX; (d): SRX; (e): CRD; (f): UNRS; (g): LRASR; (h): 3D-CAEAD
    Results of Pavia datasets anomaly detection(a): False color image; (b): Reference map; (c): RX; (d): SRX; (e): CRD; (f): UNRS; (g): LRASR; (h): 3D-CAEAD
    Fig. 6. Results of Pavia datasets anomaly detection
    (a): False color image; (b): Reference map; (c): RX; (d): SRX; (e): CRD; (f): UNRS; (g): LRASR; (h): 3D-CAEAD
    ROC curves of San Diego datasets
    Fig. 7. ROC curves of San Diego datasets
    ROC curves of Los Angeles datasets
    Fig. 8. ROC curves of Los Angeles datasets
    ROC curves of Pavia datasets
    Fig. 9. ROC curves of Pavia datasets
    名称传感器波长/μm像素波段
    San Diego-1AVRIS0.37~2.51100×100205
    San Diego-2AVRIS0.37~2.51100×100191
    San Diego-3AVRIS0.37~2.51120×120189
    San Diego-4AVRIS0.37~2.51100×100189
    Los Angeles-1AVRIS0.45~1.35100×100204
    Los Angeles-2AVRIS0.45~1.35100×100207
    Pavia-1ROSIS0.43~0.86100×100188
    Pavia-2ROSIS0.43~0.86100×100188
    Pavia-3ROSIS0.43~0.86100×100102
    Table 1. Information of datasets
    卷积层INPUT
    SIZE
    KERNEL
    SIZE
    KERNEL
    NUMBERS
    STRIDEPADDINGOUTPUT
    SIZE
    CONV1224 5 5 12×3×3322 1 1valid112 3 3 32
    CONV2112 3 3 322×1×1642 1 1valid56 3 3 64
    CONV356 3 3 642×3×31282 1 1valid28 1 1 128
    DECONV128 1 1 1282×3×3642 1 1valid56 3 3 64
    DECONV256 3 3 642×1×1322 1 1valid112 3 3 32
    DECONV3112 3 3 322×3×312 1 1valid224 5 5 1
    Table 2. 3D-CAE parameter settings
    数据集RXSRXCRDUNRSLRASR3D-CAEAD
    San Diego-10.840 40.902 50.884 00.898 70.866 00.971 7
    San Diego-20.952 60.944 10.768 10.791 70.962 20.986 9
    San Diego-30.911 10.949 50.760 20.812 60.988 70.978 4
    San Diego-40.940 30.961 70.907 10.919 80.894 90.983 3
    Los Angeles-10.990 70.724 10.965 50.972 20.954 00.993 0
    Los Angeles-20.944 00.927 50.922 40.981 60.989 90.984 6
    Pavia-10.980 70.966 40.992 80.992 90.918 70.987 8
    Pavia-20.999 10.995 80.994 40.997 60.996 30.999 9
    Pavia-30.953 80.877 70.886 80.959 90.930 50.972 4
    Table 3. AUC values of three groups of datasets
    Sheng-ming WANG, Tao WANG, Sheng-jin TANG, Yan-zhao SU. Hyperspectral Anomaly Detection Based on 3D Convolutional Autoencoder Network[J]. Spectroscopy and Spectral Analysis, 2022, 42(4): 1270
    Download Citation