• Chinese Journal of Lasers
  • Vol. 47, Issue 2, 207029 (2020)
Huang Yanxia1, Xu Hao1, Luan Ping2, Ohulchanskyy Tymish Y1, and Qu Junle1
Author Affiliations
  • 1Guangdong Province Key Laboratory of Optoelectronic Devices and Systems, Ministry of Education,College of Physics and Optoelectronic Engineering, Shenzhen University, Shenzhen 518060, China
  • 2Health Science Center, Shenzhen University, Shenzhen 518060, China
  • show less
    DOI: 10.3788/CJL202047.0207029 Cite this Article Set citation alerts
    Huang Yanxia, Xu Hao, Luan Ping, Ohulchanskyy Tymish Y, Qu Junle. Label-Free Imaging of β-Amyloid Plaques and Photodynamic Degradation[J]. Chinese Journal of Lasers, 2020, 47(2): 207029 Copy Citation Text show less
    Diagram of BPD structure of liposome
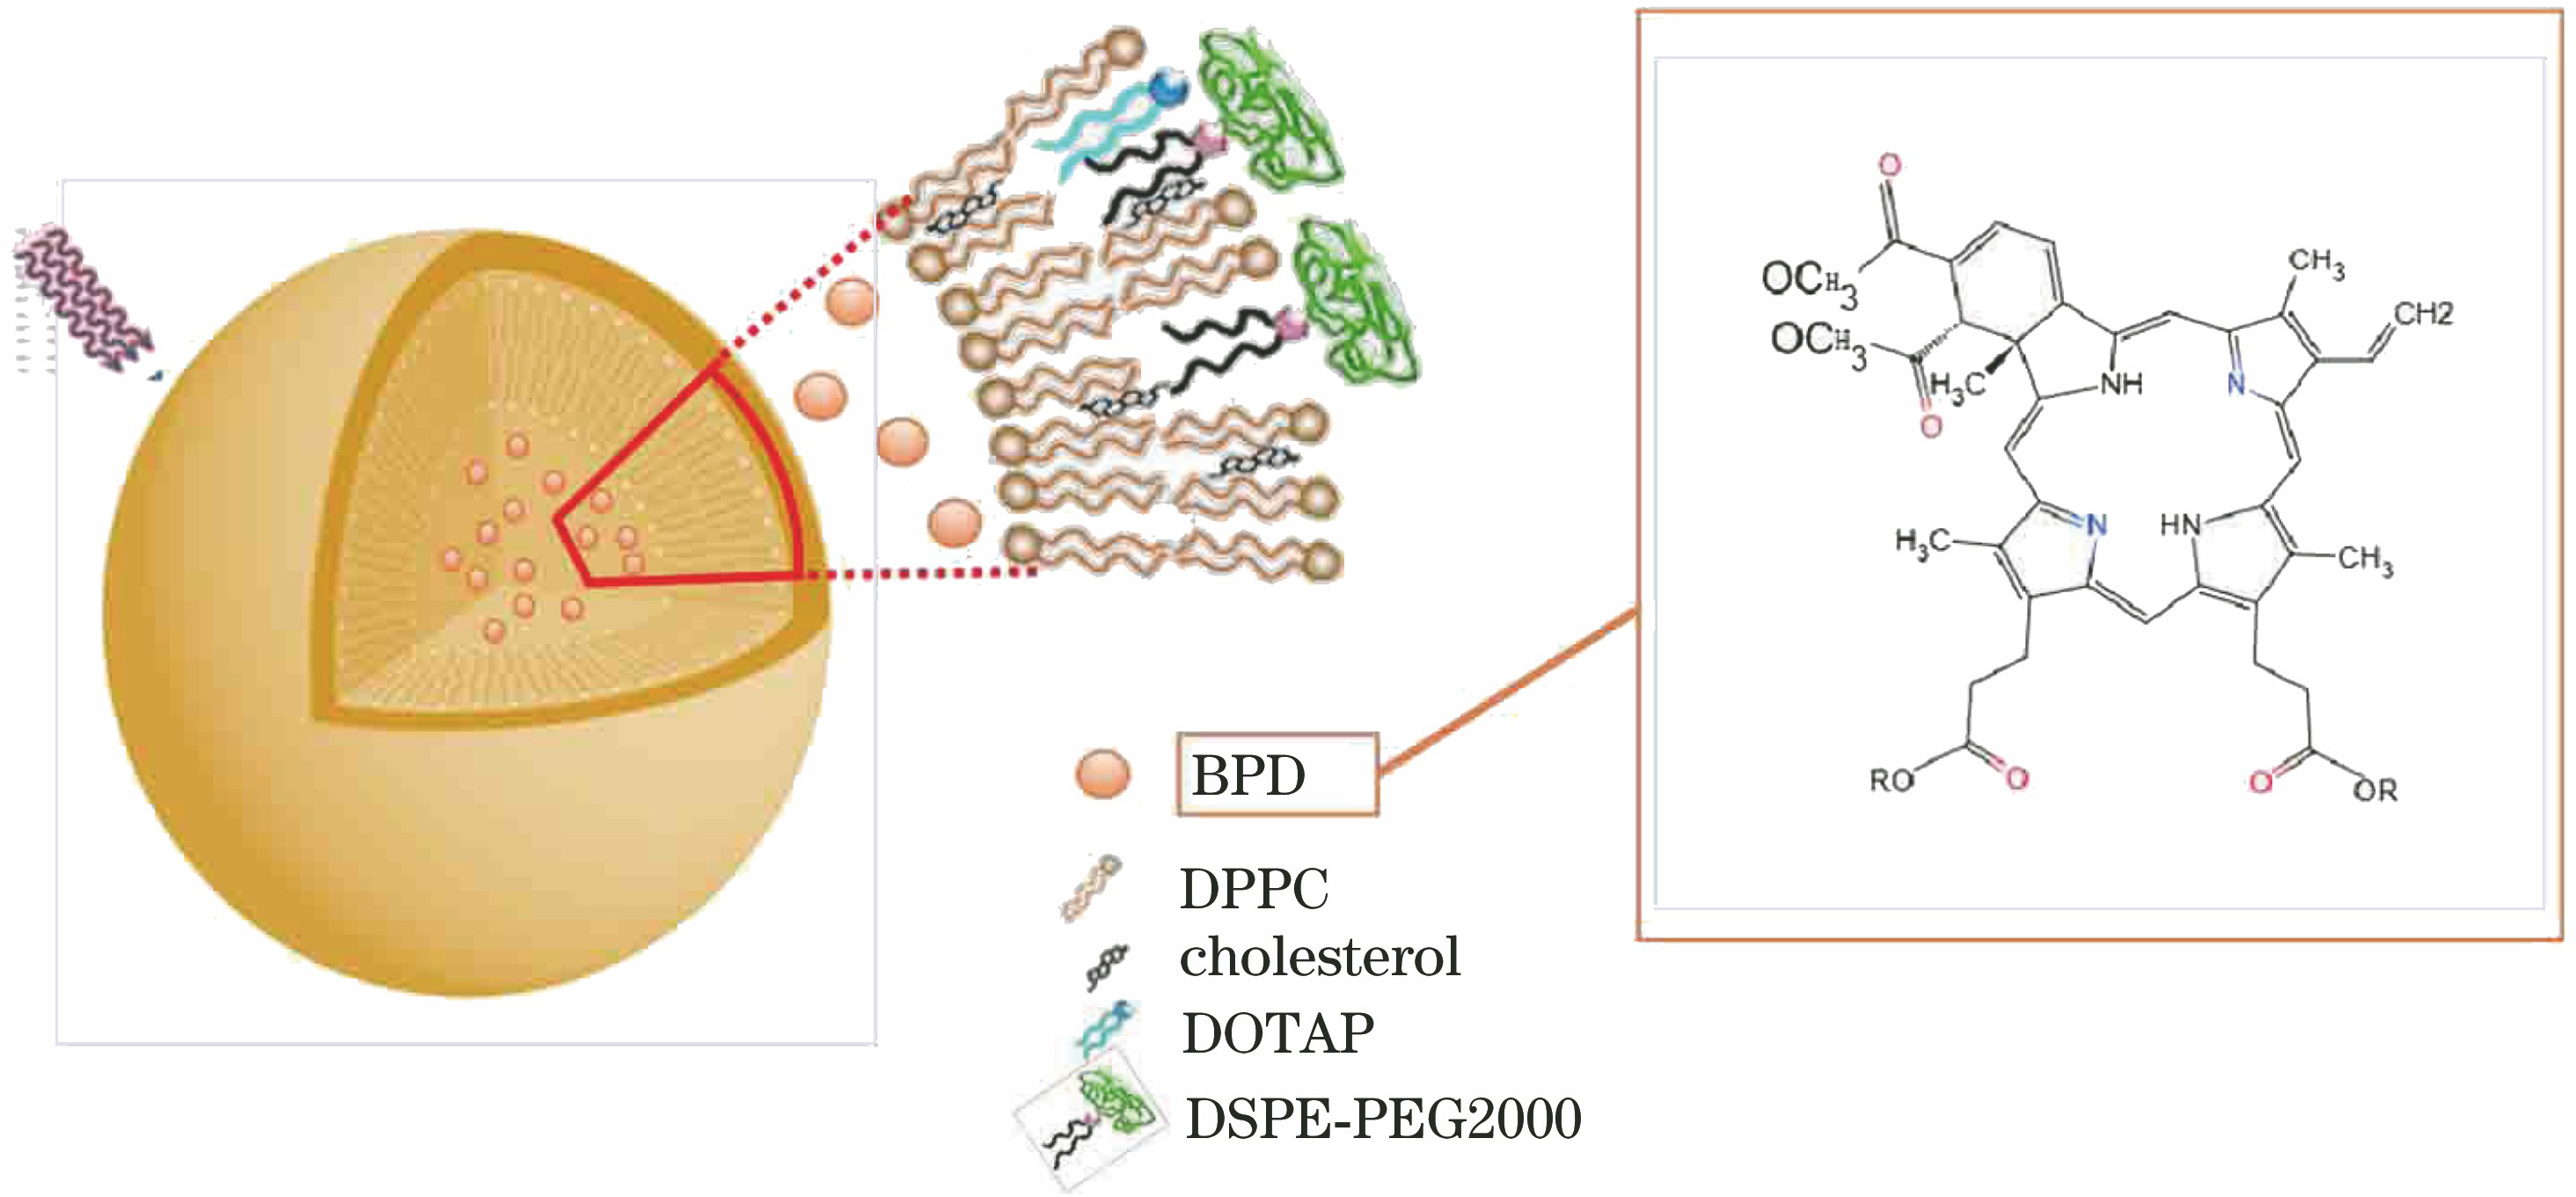
    Fig. 1. Diagram of BPD structure of liposome
    Different aggregation states of Aβ solution. (a) Aβ fibers; (b) Aβ spherulites; (c) Aβ plaques
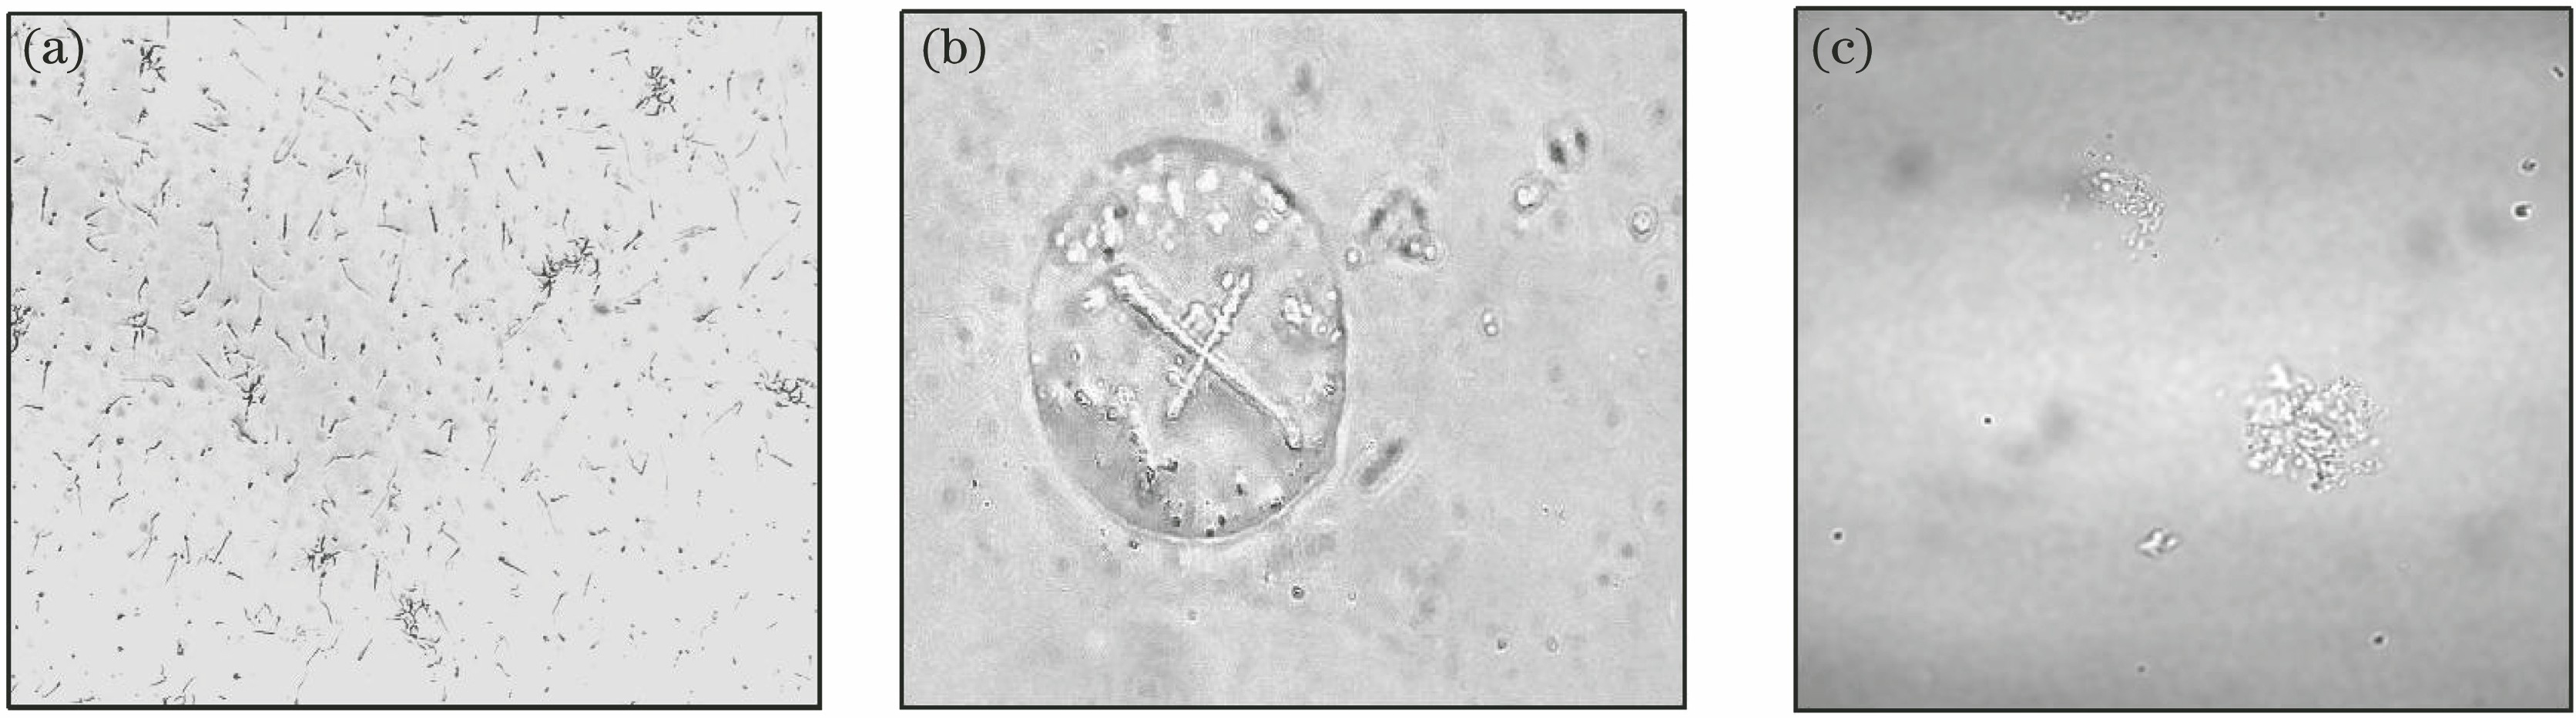
    Fig. 2. Different aggregation states of Aβ solution. (a) Aβ fibers; (b) Aβ spherulites; (c) Aβ plaques
    Absorption and fluorescence emission spectra of BPD solution with different mass concentrations. (a) BPD ultraviolet absorption spectra; (b) standard curve of BPD absorbance varying with mass concentration; (c) BPD fluorescence emission spectra; (d) standard curve of BPD fluorescence intensity varying with mass concentration
    Fig. 3. Absorption and fluorescence emission spectra of BPD solution with different mass concentrations. (a) BPD ultraviolet absorption spectra; (b) standard curve of BPD absorbance varying with mass concentration; (c) BPD fluorescence emission spectra; (d) standard curve of BPD fluorescence intensity varying with mass concentration
    Degradation mechanism of Aβ aggregates by BPD and its liposomes
    Fig. 4. Degradation mechanism of Aβ aggregates by BPD and its liposomes
    Degradation results of Aβ plaques with only irradiation. (a)(e) Bright field images; (b)(f) confocal images; (c)(g) second harmonic generation images; (d)(h) two photon excited fluorescence images
    Fig. 5. Degradation results of Aβ plaques with only irradiation. (a)(e) Bright field images; (b)(f) confocal images; (c)(g) second harmonic generation images; (d)(h) two photon excited fluorescence images
    Degradation results of Aβ plaques after irradiation when the concentration of BPD is 1 μmol/L. (a)(e) Bright field images; (b)(f) confocal images; (c)(g) second harmonic generation images; (d)(h) two photon excited fluorescence images
    Fig. 6. Degradation results of Aβ plaques after irradiation when the concentration of BPD is 1 μmol/L. (a)(e) Bright field images; (b)(f) confocal images; (c)(g) second harmonic generation images; (d)(h) two photon excited fluorescence images
    Degradation results of Aβ plaques after irradiation when the concentration of BPD is 10 μmol/L. (a)(e)(i)(m) Bright field images; (b)(f)(j)(n) confocal images; (c)(g)(k)(o) second harmonic generation images; (d)(h)(l)(p) two photon excited fluorescence images
    Fig. 7. Degradation results of Aβ plaques after irradiation when the concentration of BPD is 10 μmol/L. (a)(e)(i)(m) Bright field images; (b)(f)(j)(n) confocal images; (c)(g)(k)(o) second harmonic generation images; (d)(h)(l)(p) two photon excited fluorescence images
    Relationship between fluorescence intensity of Aβ plaques and irradiation time
    Fig. 8. Relationship between fluorescence intensity of Aβ plaques and irradiation time
    Degradation results of Aβ plaques after irradiation when the concentration of BPD is 100 μmol/L. (a)(e) Bright field images; (b)(f) confocal images; (c)(g) second harmonic generation images; (d)(h) two photon excited fluorescence images
    Fig. 9. Degradation results of Aβ plaques after irradiation when the concentration of BPD is 100 μmol/L. (a)(e) Bright field images; (b)(f) confocal images; (c)(g) second harmonic generation images; (d)(h) two photon excited fluorescence images
    Relationship between degradation efficiency of Aβplaques and concentration of BPD
    Fig. 10. Relationship between degradation efficiency of Aβplaques and concentration of BPD
    ELISA detection results of Aβ content after irradiation with different doses
    Fig. 11. ELISA detection results of Aβ content after irradiation with different doses
    Degradation results of Aβ plaques after irradiation with BPD liposome. (a)(e) Bright field images; (b)(f) confocal images; (c)(g) second harmonic generation images; (d)(h) two photon excited fluorescence images
    Fig. 12. Degradation results of Aβ plaques after irradiation with BPD liposome. (a)(e) Bright field images; (b)(f) confocal images; (c)(g) second harmonic generation images; (d)(h) two photon excited fluorescence images
    Huang Yanxia, Xu Hao, Luan Ping, Ohulchanskyy Tymish Y, Qu Junle. Label-Free Imaging of β-Amyloid Plaques and Photodynamic Degradation[J]. Chinese Journal of Lasers, 2020, 47(2): 207029
    Download Citation