
Ding-rong YI, Ling-hua KONG, Yan-li ZHAO, Zi-han YANG. Color Recovery Method for Snapshot Narrow Band Spectral Imaging Technology[J]. Spectroscopy and Spectral Analysis, 2021, 41(1): 183
- Spectroscopy and Spectral Analysis
- Vol. 41, Issue 1, 183 (2021)

Fig. 1. From the SNBSI images, select three bands N_R, N_G, and N_B that are closet to red, green, andblue, respectively, and arrange them into Bayer filter array pattern
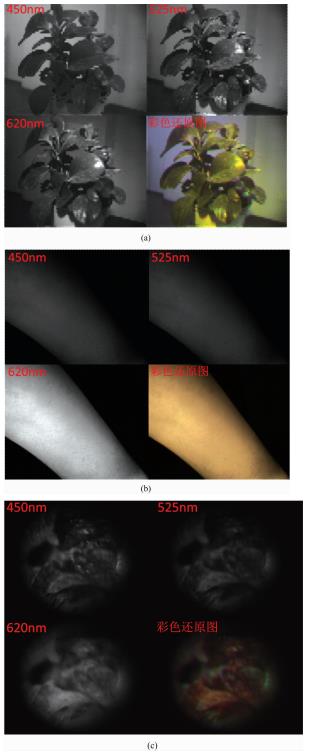
Fig. 2. Color recovery results by the modified CIE three primary color based recovery method from SNBI images of (a) plant, (b) forearm, and (c) cervical tissue
Fig. 3. Color recovery results by the modified Bayer-filter-array pattern based interpolation from SNBI images of (a) plant, (b) forearm, and (c) cervical tissue
Fig. 4. Comparison of color correction result
Before correction (a1), (b1), (c1) and after correction (a2), (b2), (c2) of a plant, forearm, and cervical tissues
Before correction (a1), (b1), (c1) and after correction (a2), (b2), (c2) of a plant, forearm, and cervical tissues
| ||||||||||||||||||||||||||||||||||||||||||||||||||
Table 1. Effectiveness comparison between the two color recovery methods applied
|
Table 2. Mean color aberration comparison between before and after the application of the color correction algorithm

Set citation alerts for the article
Please enter your email address
© Copyright 2018-2021 | Chinese Laser Press. All Rights Reserved 沪ICP备15018463号-20