
Xiaohui Wang, Lushen Wu, Huawei Chen, Yun Hu, Yaying Shi. Feature Line Extraction from a Point Cloud Based on Region Clustering Segmentation[J]. Acta Optica Sinica, 2018, 38(11): 1110001
- Acta Optica Sinica
- Vol. 38, Issue 11, 1110001 (2018)
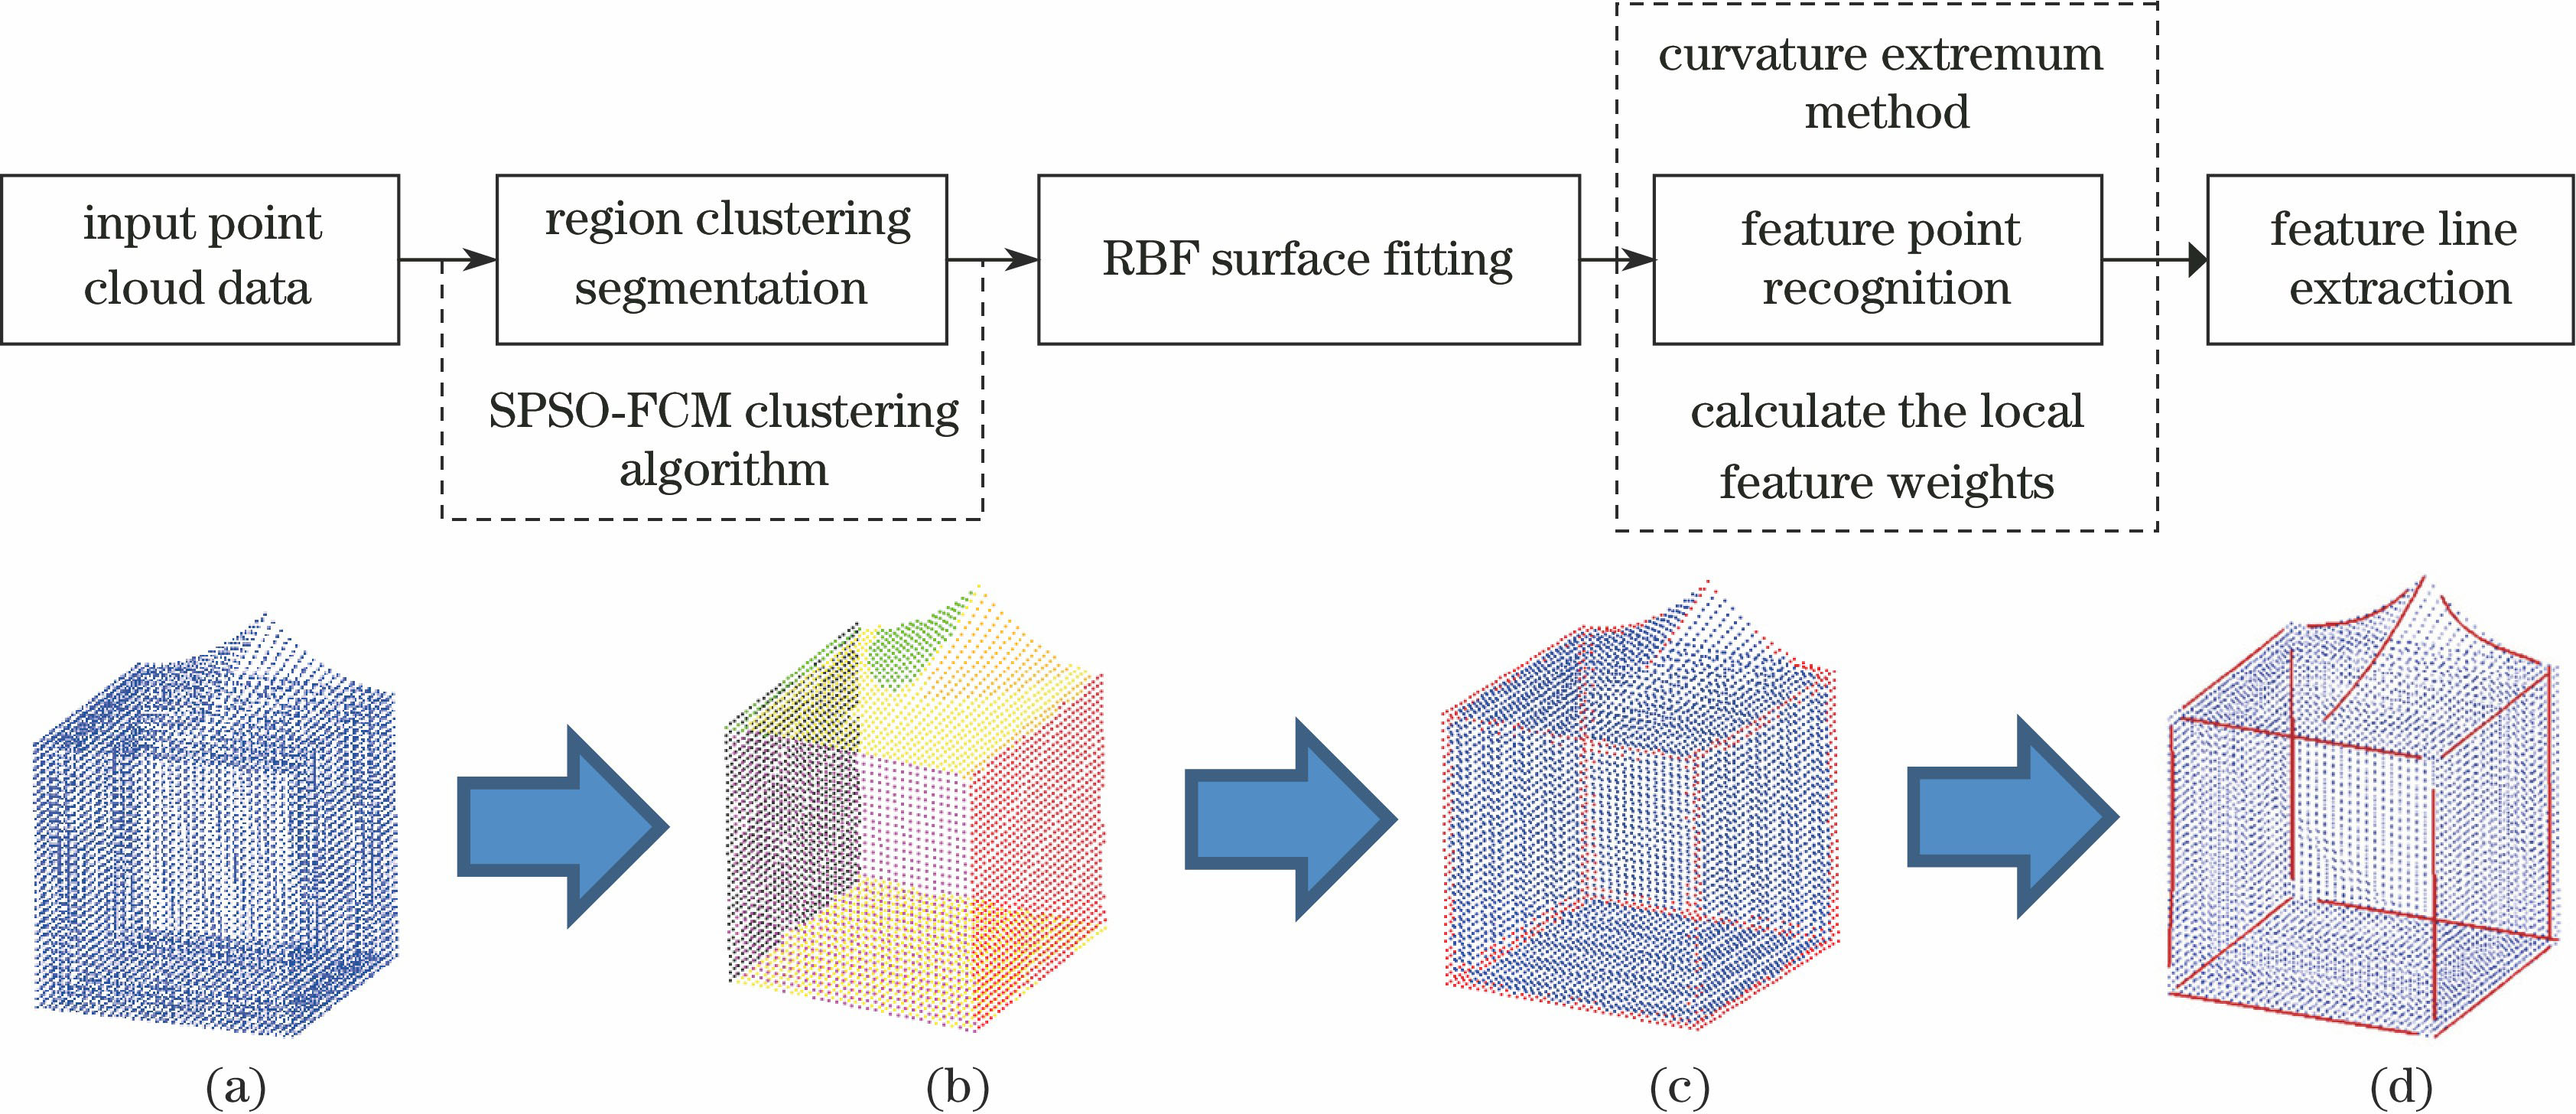
Fig. 1. Overall procedure of the proposed method. (a) Original point cloud; (b) region clustering segmentation result; (c) feature point recognition result; (d) generation of the feature lines
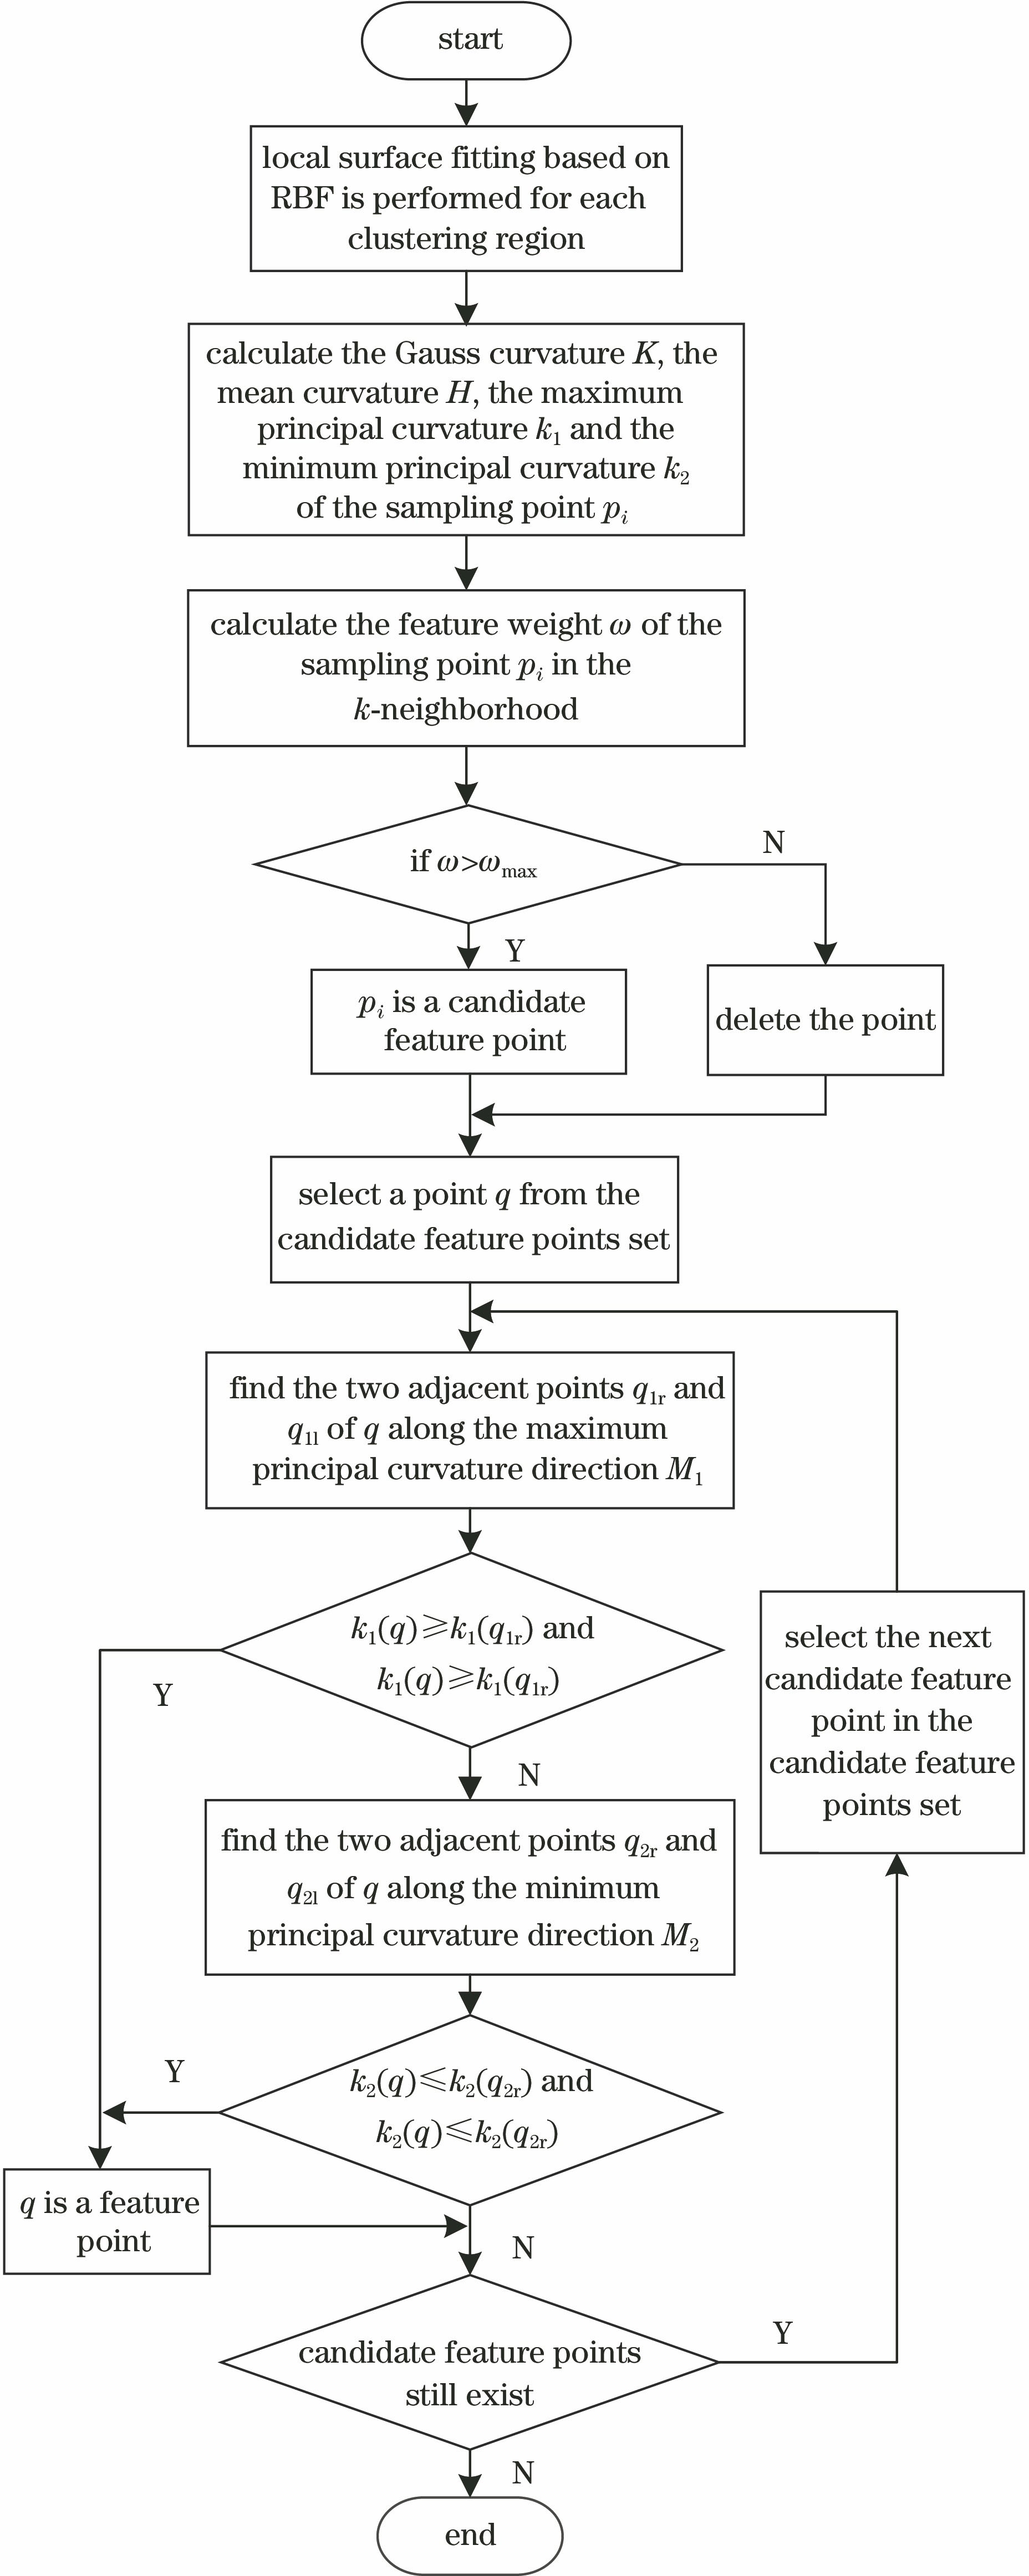
Fig. 2. Flow chart of the feature point recognition stage
Fig. 3. Feature line extraction from Model 1. (a) Original point cloud of Model 1; (b) region clustering segmentation; (c) set of candidate feature points; (d) set of feature points; (e) feature line extraction results
Fig. 4. Feature line extraction from Model 2. (a) Triangulated lighting model of Model 2; (b) region clustering segmentation; (c) set of candidate feature points; (d) set of feature points; (e) feature line extraction results
Fig. 5. Feature line extraction from Model 3. (a) Triangulated lighting model of Model 3; (b) region clustering segmentation; (c) set of candidate feature points; (d) set of feature points; (e) feature line extraction results
Fig. 6. Feature line extraction from Model 4. (a) Triangulated lighting model of Model 4; (b) region clustering segmentation; (c) set of candidate feature points; (d) set of feature points; (e) feature line extraction results
Fig. 7. Comparison of the feature extraction methods used in Model 4. (a) Ref. [13] method; (b) proposed method
Fig. 8. Comparison of the feature extraction methods used in Model 5. (a) Triangulated lighting model of Model 5; (b) Ref. [13] method; (c) proposed method
Fig. 9. Feature line extracted by the proposed method using different neighborhood scales. (a1) Original point cloud and its partial enlarged detail in Model 3; extraction effects with (a2) k=10, (a3)k=16, (a4)k=25; (a5) feature line of Model 3; (b1) original point cloud and its partial enlarged detail in Model 4; extraction effects with (b2) k=10, (b3) k=16, (b4) k=25; (b5) feature line of Model 4
Fig. 10. Results of the proposed method for noisy datasets. (a)-(c) Add noise of 15 dB, 20 dB and 30 dB in Model 2, respectively; (d)-(f) add noise of 45 dB, 50 dB and 60 dB in Model 4, respectively
|
Table 1. Complexity in different stages
|
Table 2. Duration of the feature extraction pipeline in seconds

Set citation alerts for the article
Please enter your email address
© Copyright 2018-2021 | Chinese Laser Press. All Rights Reserved 沪ICP备15018463号-20