• Laser & Optoelectronics Progress
  • Vol. 59, Issue 16, 1628007 (2022)
Rui Huang1, Jianqiang Han1, Jintian Li2、*, Runchi Ji2, and Lei Wu2
Author Affiliations
  • 1Sino-Pipeline International Company, Beijing 102200, China
  • 2Beijing Deep Blue Space Remote Sensing Technology Co., Ltd., Beijing 100101, China
  • show less
    DOI: 10.3788/LOP202259.1628007 Cite this Article Set citation alerts
    Rui Huang, Jianqiang Han, Jintian Li, Runchi Ji, Lei Wu. Applications of Persistent Scatterer Interferometric Synthetic Aperture Radar Technology for Subsidence Monitoring of Sino-Myanmar Oil and Gas Pipelines[J]. Laser & Optoelectronics Progress, 2022, 59(16): 1628007 Copy Citation Text show less
    Basic schematic diagram of D-InSAR
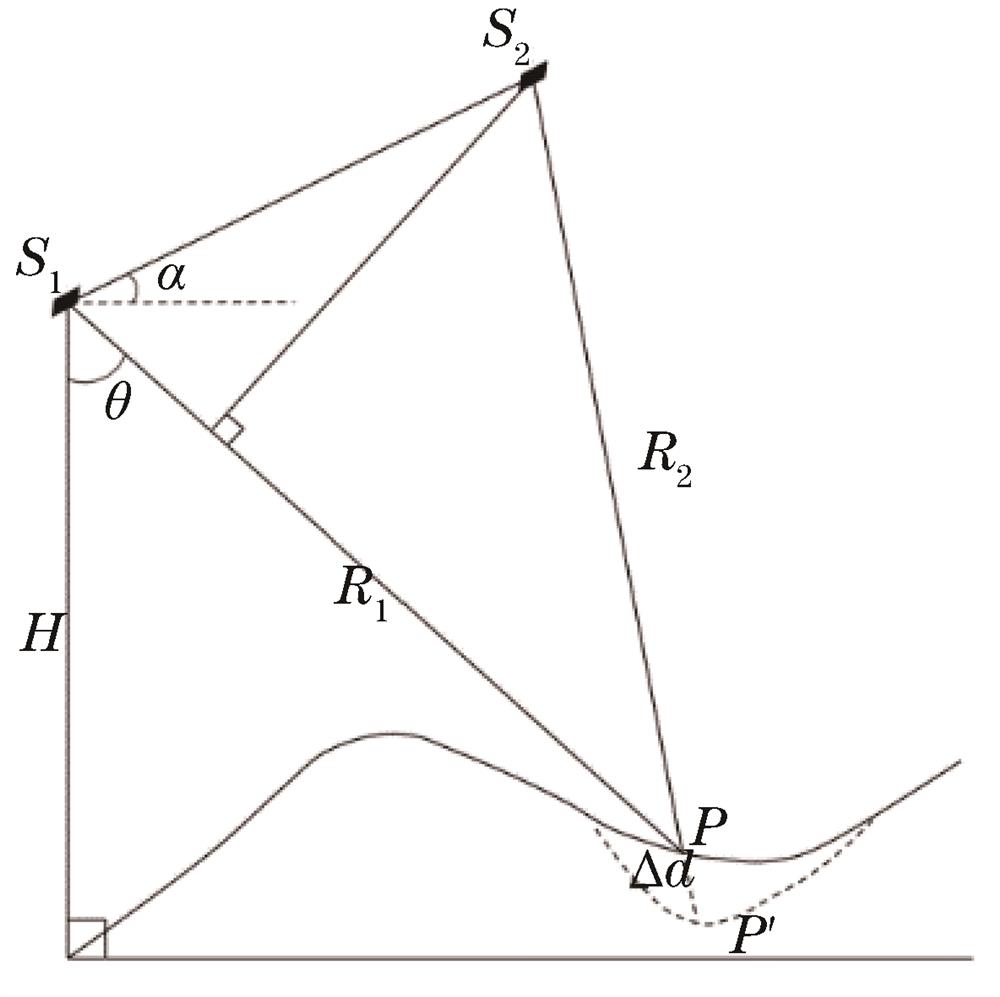
    Fig. 1. Basic schematic diagram of D-InSAR
    Flow chart of PS-InSAR technology
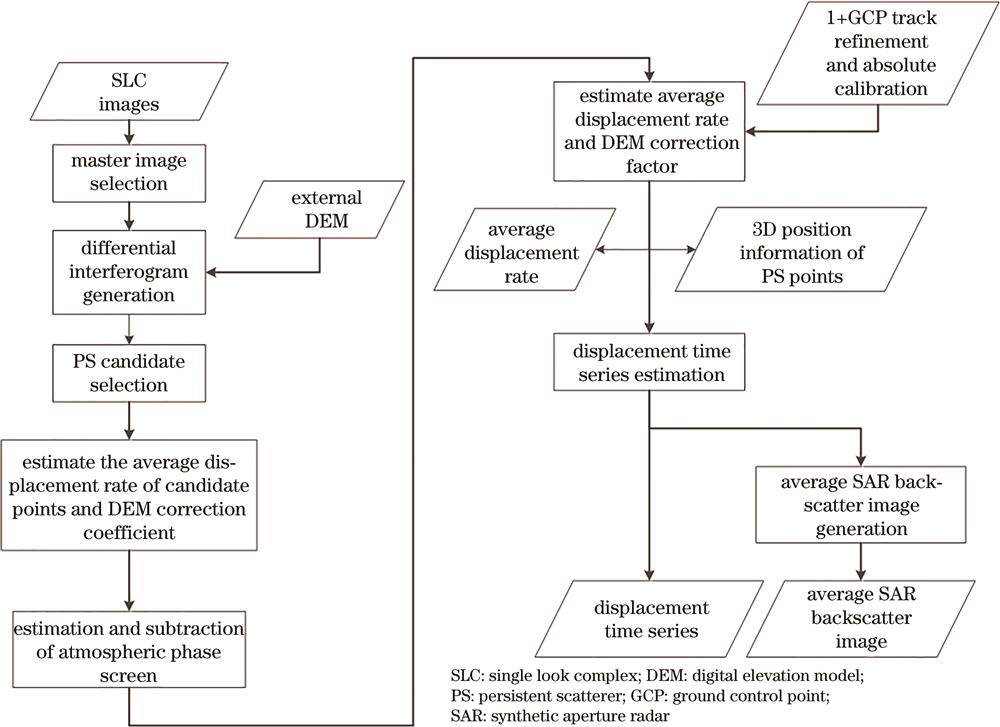
    Fig. 2. Flow chart of PS-InSAR technology
    Schematic diagram of relationship between image range and pipeline position. (a) Relationship between image range of ascending orbit and pipeline position; (b) relationship between image range of descending orbit and pipeline position
    Fig. 3. Schematic diagram of relationship between image range and pipeline position. (a) Relationship between image range of ascending orbit and pipeline position; (b) relationship between image range of descending orbit and pipeline position
    Histograms of average annual deformation rate of PS points of ascending and descending orbits. (a) Ascending orbit; (b) descending orbit
    Fig. 4. Histograms of average annual deformation rate of PS points of ascending and descending orbits. (a) Ascending orbit; (b) descending orbit
    Deformation distribution maps of PS points of Sino-Myanmar natural gas pipeline—Rakayama section. (a) Deformation distribution map of PS points of ascending orbit; (b) deformation distribution map of PS points of descending orbit
    Fig. 5. Deformation distribution maps of PS points of Sino-Myanmar natural gas pipeline—Rakayama section. (a) Deformation distribution map of PS points of ascending orbit; (b) deformation distribution map of PS points of descending orbit
    Distributions of surface deformation results based on image fitting of ascending and descending orbits. (a) Based on ascending orbit; (b) based on descending orbit
    Fig. 6. Distributions of surface deformation results based on image fitting of ascending and descending orbits. (a) Based on ascending orbit; (b) based on descending orbit
    Vertical deformation results obtained based on fusion of ascending and descending orbits
    Fig. 7. Vertical deformation results obtained based on fusion of ascending and descending orbits
    Distribution map of local deformation abnormal area
    Fig. 8. Distribution map of local deformation abnormal area
    Results of multi-source data information acquisition in study area. (a) Slope data information; (b) aspect data information; (c) information on the shortest distance from the road; (d) information on the shortest distance from the river; (e) soil type information; (f) vegetation coverage information
    Fig. 9. Results of multi-source data information acquisition in study area. (a) Slope data information; (b) aspect data information; (c) information on the shortest distance from the road; (d) information on the shortest distance from the river; (e) soil type information; (f) vegetation coverage information
    Distribution map of landslide risk area
    Fig. 10. Distribution map of landslide risk area
    Distribution map of first and second landslide risk areas. (a) Distribution map of landslide first-level risk area; (b) distribution map of landslide secondary risk area
    Fig. 11. Distribution map of first and second landslide risk areas. (a) Distribution map of landslide first-level risk area; (b) distribution map of landslide secondary risk area
    Distribution of pipeline risk areas
    Fig. 12. Distribution of pipeline risk areas
    Distribution of first and second pipeline risk areas. (a) Distribution map of pipeline first-level risk area; (b) distribution map of pipeline secondary risk area
    Fig. 13. Distribution of first and second pipeline risk areas. (a) Distribution map of pipeline first-level risk area; (b) distribution map of pipeline secondary risk area
    Serial numberImage acquisition dateNumber of images in the same periodSerial numberImage acquisition dateNumber of images in the same period
    120180601219201908192
    220180625220201909122
    320180719221201910062
    420180812222201910302
    520180905223201911232
    620180929224201912172
    720181011225202001102
    820181128226202002032
    920181222227202002272
    1020190115228202003222
    1120190208229202004152
    1220190304230202005092
    1320190328231202006022
    1420190421232202006262
    1520190515233202007202
    1620190608234202008132
    1720190702235202009062
    1820190726236202009302
    Table 1. Ascending orbit image information
    Serial numberImage acquisition dateNumber of images in the same periodSerial numberImage acquisition dateNumber of images in the same period
    120180809215201911202
    220180902216201912142
    320180926217201901072
    420181020218202001312
    520181101219202002242
    620181125220202003192
    720181219221202004122
    820190112222202004242
    920190124223202005302
    1020190205224202007052
    1120190816225202007292
    1220190909226202008222
    1320191003227202009152
    1420191027228202009272
    Table 2. Descending orbit image information
    Rui Huang, Jianqiang Han, Jintian Li, Runchi Ji, Lei Wu. Applications of Persistent Scatterer Interferometric Synthetic Aperture Radar Technology for Subsidence Monitoring of Sino-Myanmar Oil and Gas Pipelines[J]. Laser & Optoelectronics Progress, 2022, 59(16): 1628007
    Download Citation