
Shikai Jin, Jiangtao Xu, Kaiming Nie. Low-Illumination Color Image Enhancement System Based on Single Sensor[J]. Laser & Optoelectronics Progress, 2021, 58(14): 1410001
- Laser & Optoelectronics Progress
- Vol. 58, Issue 14, 1410001 (2021)
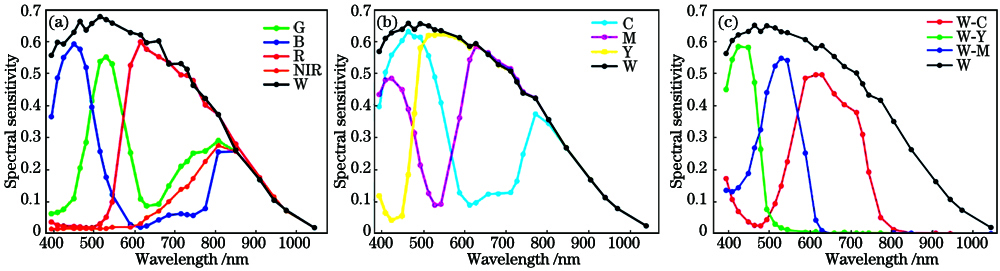
Fig. 1. Sensor spectral sensitivity. (a) SS of RGB+NIR CFA; (b) SS of CMYW CFA; (c) SS of CMYW subtraction
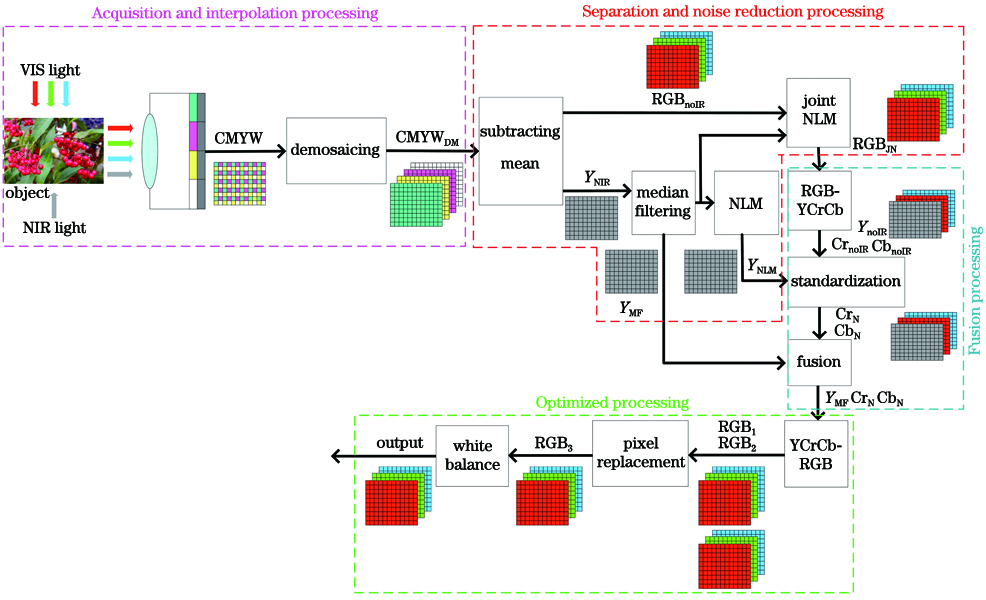
Fig. 2. Image enhancement system architecture
Fig. 3. Experimental environment. (a) Darkroom environment for image acquisition; (b) enlargement of some details
Fig. 4. Comparison of noise reduction effects for different algorithms. (a) Difference; (b) BF; (c) JBF; (d) NLM; (e) INLM; (f) Joint NLM
Fig. 5. First group of images in different environments and images processed by different algorithms. (a) Image without NIR under normal illumination; (b) image without NIR under low illumination; (c) image with NIR under low illumination; (d) low illumination image processed by system in Ref. [11]; (e) low illumination image processed by system in Ref. [14]; (f) low illumination image processed by proposed system
Fig. 6. Second group of images in different environments and images processed by different algorithms. (a) Image without NIR under normal illumination; (b) image without NIR under low illumination; (c) image with NIR under low illumination; (d) low illumination image processed by system in Ref. [11]; (e) low illumination image processed by system in Ref. [14]; (f) low illumination image processed by proposed system
Fig. 7. Third group of images in different environments and images processed by different algorithms. (a) Image without NIR under normal illumination; (b) image without NIR under low illumination; (c) image with NIR under low illumination; (d) low illumination image processed by system in Ref. [11]; (e) low illumination image processed by system in Ref. [14]; (f) low illumination image processed by proposed system
|
Table 1. PSNR comparison of images processed by different noise reduction algorithms unit: dB
|
Table 2. Brightness mean values comparison of three groups of images
|
Table 3. Structural similarity comparison of three groups of images
|
Table 4. Comparison of PSNR of three groups of images unit: dB

Set citation alerts for the article
Please enter your email address
© Copyright 2018-2021 | Chinese Laser Press. All Rights Reserved 沪ICP备15018463号-20