
Qiang GUO, Rui WEN, Xin WANG. Cloud detection technique research for Geosynchronous Interferometric Infrared Sounder(GIIRS) on FY-4A platform [J]. Journal of Infrared and Millimeter Waves, 2020, 39(6): 760
- Journal of Infrared and Millimeter Waves
- Vol. 39, Issue 6, 760 (2020)
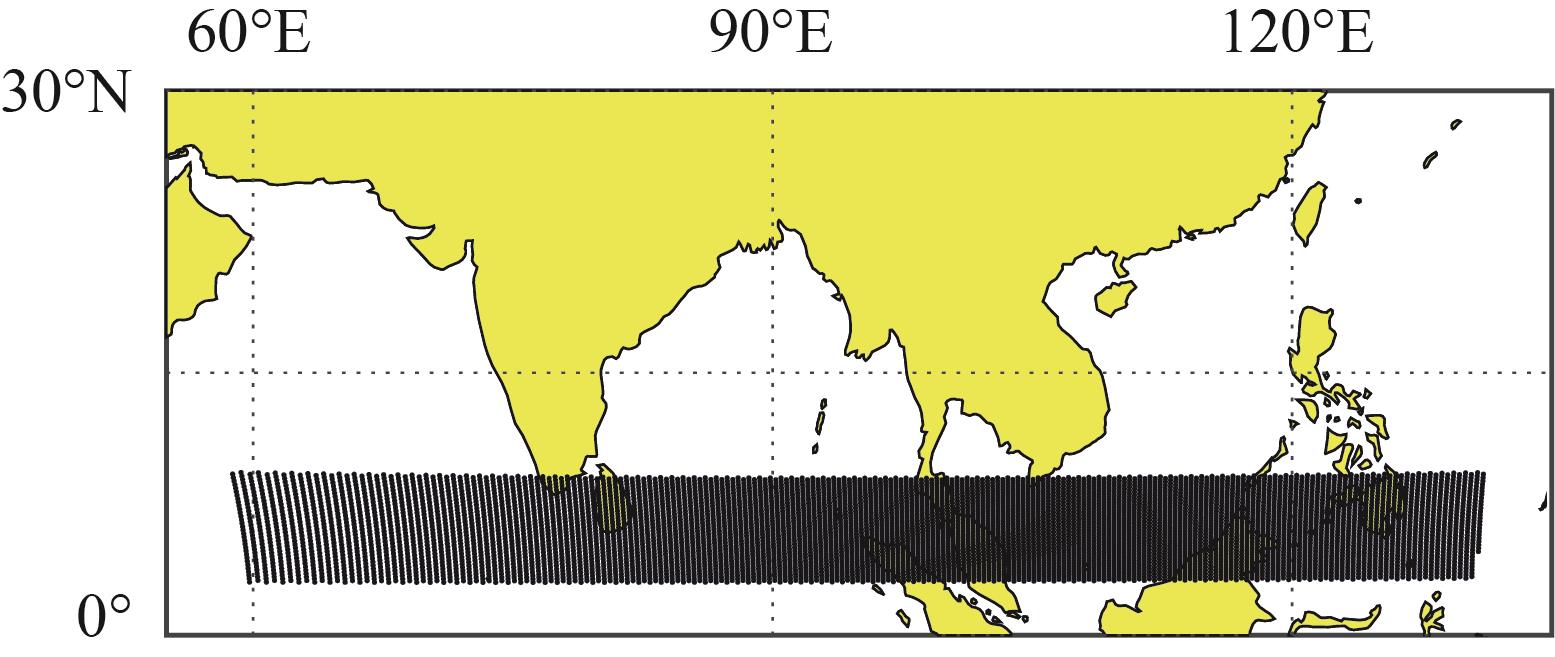
Fig. 1. The location of selected GIIRS FOV
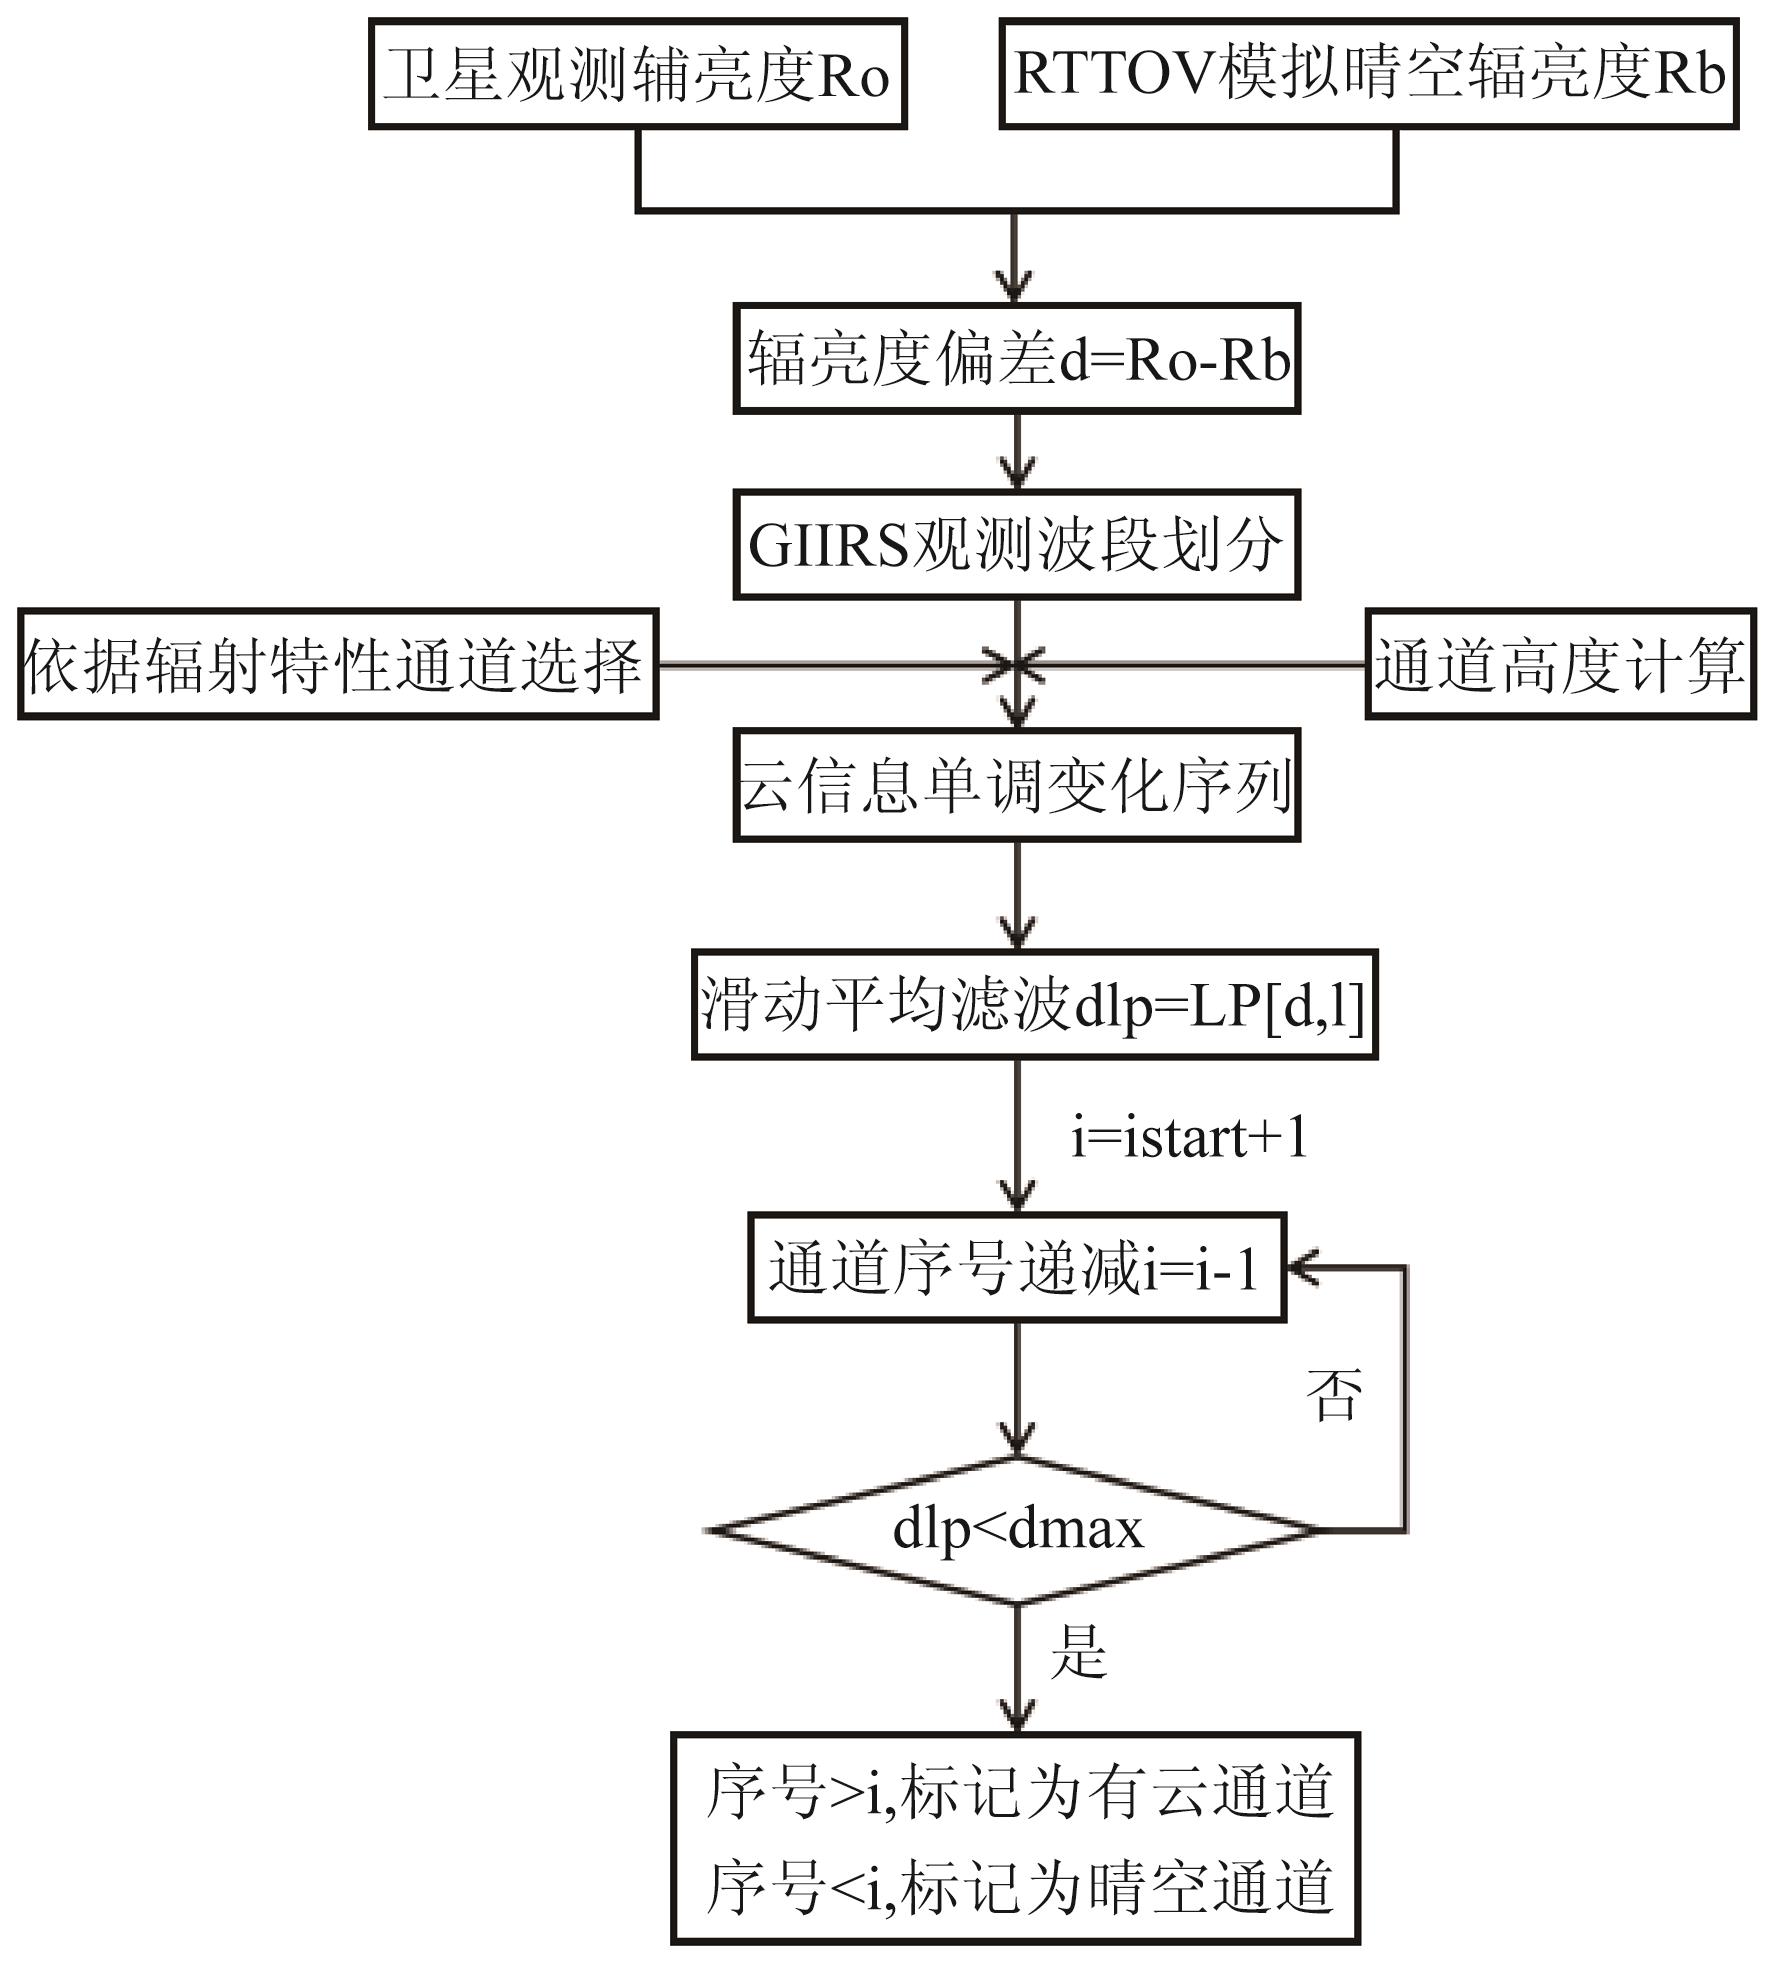
Fig. 2. Flow chart of cloud detection
Fig. 3. (a)Weighting function peak and channel height, and (b)peak weighting function of three channels
Fig. 4. Statistical result of NEDR from GIIRS real-time data
Fig. 5. Bias of different FOV based on ranked channel height
Fig. 6. Cloud detection result at 0600 UTC 10 May 2019,(a) result after matching the AGRI CLM data,(b) cloud detection result, and (c) AGRI CLM data
Fig. 7. Cloud detection result at 1200 UTC 10 May 2019,(a) result after matching the AGRI CLM data,(b) cloud detection result, and (c) AGRI CLM data
Fig. 8. Cloud detection result at 0600 UTC 11 May 2019,(a) result after matching the AGRI CLM data,(b) cloud detection result, and (c) AGRI CLM data
Fig. 9. Cloud detection result at 1200 UTC 11 May 2019,(a) result after matching the AGRI CLM data,(b) cloud detection result, and (c) AGRI CLM data
Fig. 10. Cloud detection result at 0600 UTC 12 May 2019,(a) result after matching the AGRI CLM data,(b) cloud detection result, and (c) AGRI CLM data
Fig. 11. Cloud detection result at 1200 UTC 12 May 2019,(a) result after matching the AGRI CLM data,(b) cloud detection result, and (c) AGRI CLM data
|
Table 1. GIIRS长波CO2波段选出的通道
|
Table 2. 受云污染视场的可用通道百分占比

Set citation alerts for the article
Please enter your email address
© Copyright 2018-2021 | Chinese Laser Press. All Rights Reserved 沪ICP备15018463号-20