
Yanling Du, Jianhua Cui, Quanmiao Wei, Dongmei Huang. Marine Oil-Spill Detection in Multi-Polarization Image-Based SAR on Improved FCN[J]. Laser & Optoelectronics Progress, 2022, 59(4): 0415005
- Laser & Optoelectronics Progress
- Vol. 59, Issue 4, 0415005 (2022)
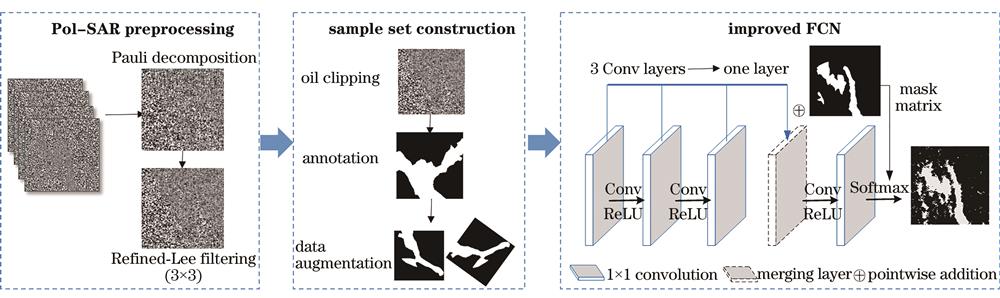
Fig. 1. Intelligent detection framework of Pol-SAR image based on improved FCN
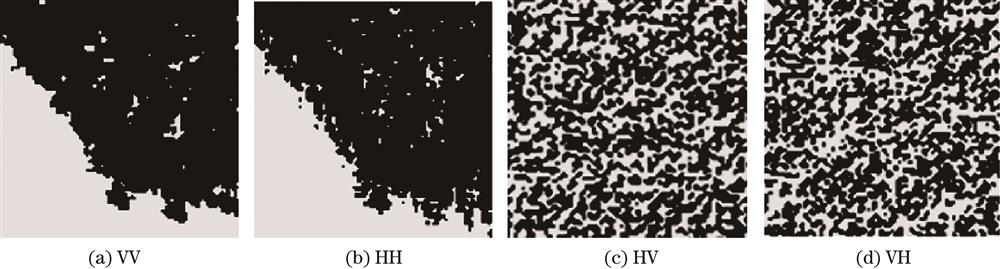
Fig. 2. Comparison of oil spill area detection under different polarization modes
Fig. 3. Comparison of oil spill detections of two polarimetric fusion SAR images. (a) HH-VV; (b) HH-HV; (c) HH-VH; (d) HV-VH; (e) HV-VV; (f) VH-VV
Fig. 4. Oil spill results of three-polarimetric fusion and full-polarimetric fusion. (a) HH-HV-VH; (b) HH-HV-VV; (c) HH-VH-VV; (d) HV-VH-VV; (e) HH-VV-HV-VH
Fig. 5. Results of oil spill area detected by different methods. (a) Original imags; (b) labeled imags; (c) FCN; (d) UNet; (e) Improved FCN
|
Table 1. Information on the RadarSAT-2 SAR image used in this study
|
Table 2. Detection result comparison of oil spill after Pol-SAR image preprocessing
|
Table 3. Comparison of oil spill detection accuracy of two polarimetric fusion SAR images
|
Table 4. Comparison of oil spill detection accuracy of three-polarimetric fusion and full-polarimetric fusion
|
Table 5. Accuracy of fully polarized oil spill detection in different regions
|
Table 6. Oil spill detection accuracy in different regions

Set citation alerts for the article
Please enter your email address
© Copyright 2018-2021 | Chinese Laser Press. All Rights Reserved 沪ICP备15018463号-20