
Kewei Huan, Xiangyang Li, Yutong Cao, Xiao Chen. Infrared and visible image fusion of convolutional neural network and NSST[J]. Infrared and Laser Engineering, 2022, 51(3): 20210139
- Infrared and Laser Engineering
- Vol. 51, Issue 3, 20210139 (2022)
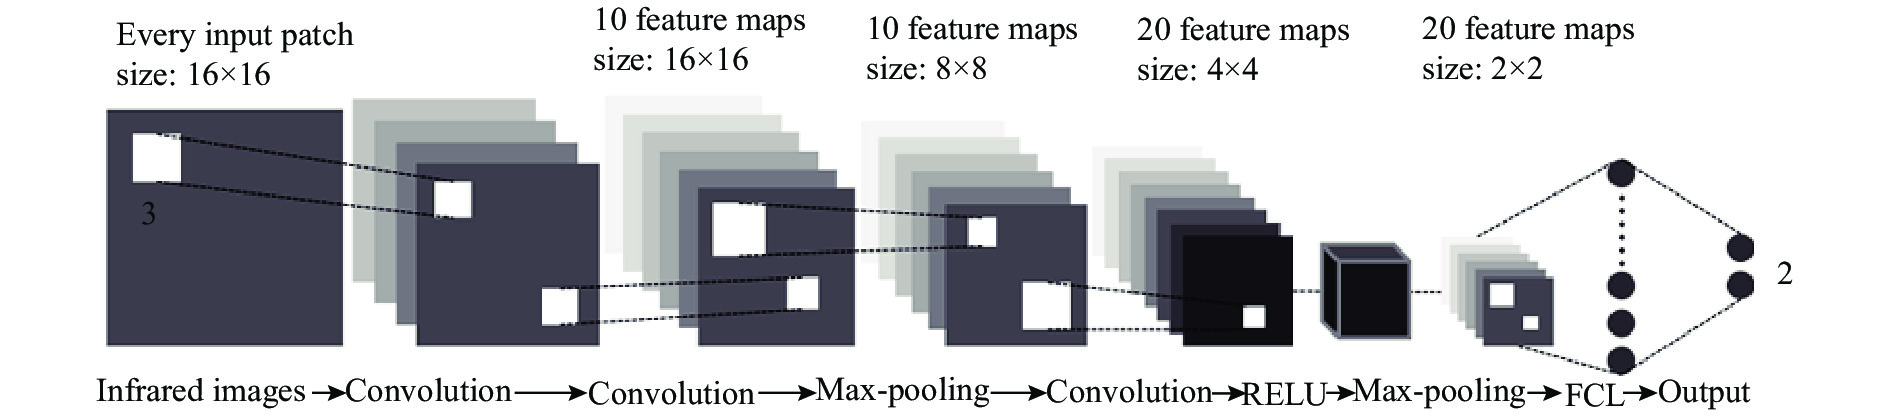
Fig. 1. Convolutional neural network structure
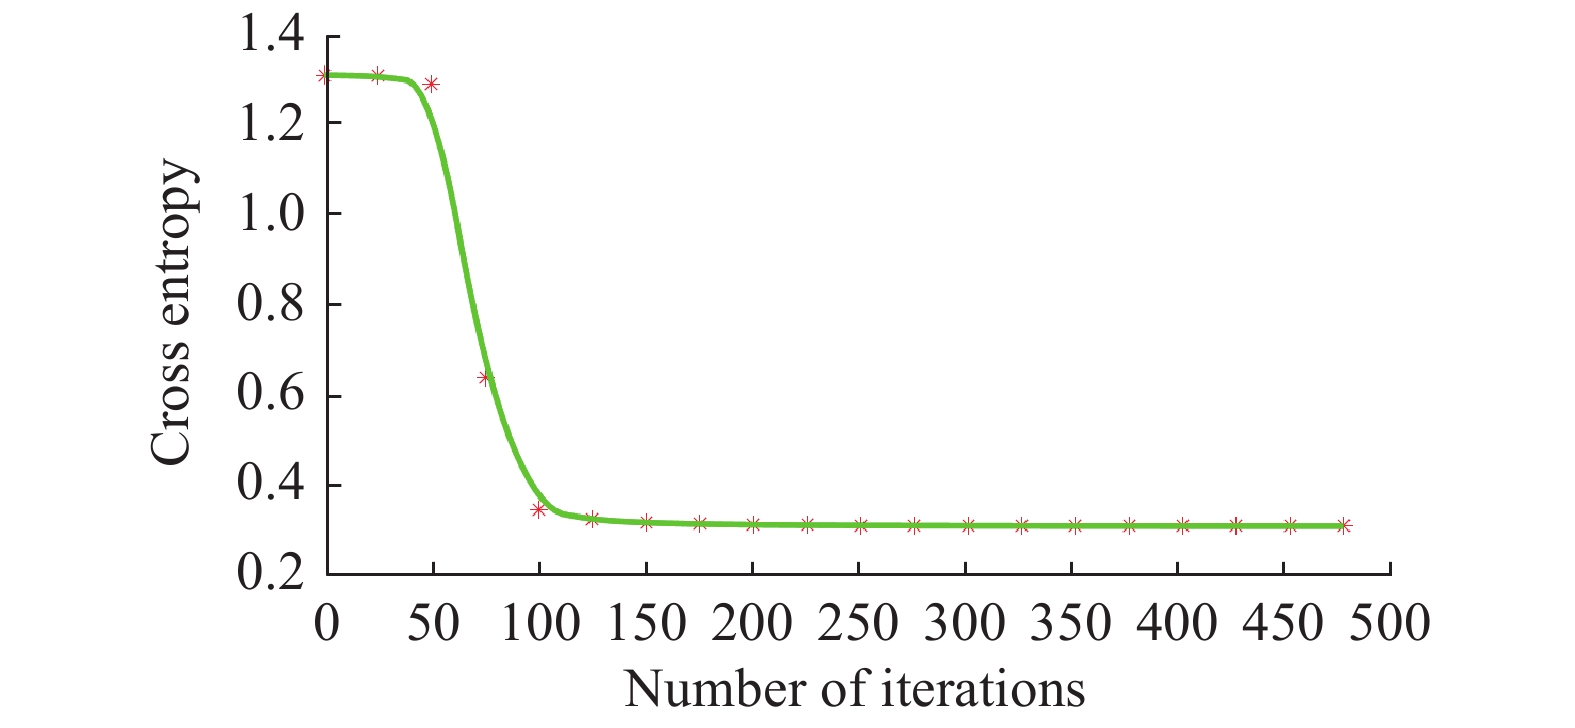
Fig. 2. Cross entropy loss function
Fig. 3. Infrared image ''UN Camp''and images after saliency extraction by various methods. (a) Infrared image "UN Camp"; (b) Standard segmentation of image "UN Camp"; (c) AC method; (d) SR method; (e) LC method; (f) FT method; (g) CNN method; (h) CNN+FT method
Fig. 4. Infrared image ''dune'' and images after saliency extraction by various methods. (a) Infrared image "dune"; (b) Standard segmentation of image "dune"; (c) AC method; (d) SR method; (e) LC method; (f) FT method; (g) CNN method; (h) CNN+FT method
Fig. 5. Image fusion model based on convolutional neural network and NSST
Fig. 6. ''UN Camp'' infrared and visible images and fusion results. (a) Infrared image; (b) Visible image; (c) DWT method; (d) CS method; (e) BEMD method; (f) NSCT+FL method; (g) NSST+FL method; (h) Proposed method; (i) Significant area fusion image
Fig. 7. ''dune'' infrared and visible images and fusion results. (a) Infrared image; (b) Visible image; (c) DWT method; (d) CS method; (e) BEMD method; (f) NSCT+FL method; (g) NSST+FL method; (h) Proposed method; (i) Significant area fusion image
Fig. 8. ''iron'' infrared and visible images and fusion results. (a) Infrared image; (b)Visible image; (c) DWT method; (d) CS method; (e) BEMD method; (f) NSCT+FL method; (g) NSST+FL method; (h) Proposed method; (i) Significant area fusion image
|
Table 1. Target significance extraction evaluation index MAE
|
Table 2. Infrared and visible image fusion effect evaluation

Set citation alerts for the article
Please enter your email address
© Copyright 2018-2021 | Chinese Laser Press. All Rights Reserved 沪ICP备15018463号-20