
Lixin Jiang, Qi Yuan, Hao Yang, Yongfeng Li, Lin Zheng, Zhibiao Zhu, Shuang Liang, Yongqiang Pang, He Wang, Jiafu Wang, Shaobo Qu. Shape memory alloy-based 3D morphologically reconfigurable chiral metamaterial for tailoring circular dichroism by voltage control[J]. Photonics Research, 2023, 11(3): 373
- Photonics Research
- Vol. 11, Issue 3, 373 (2023)
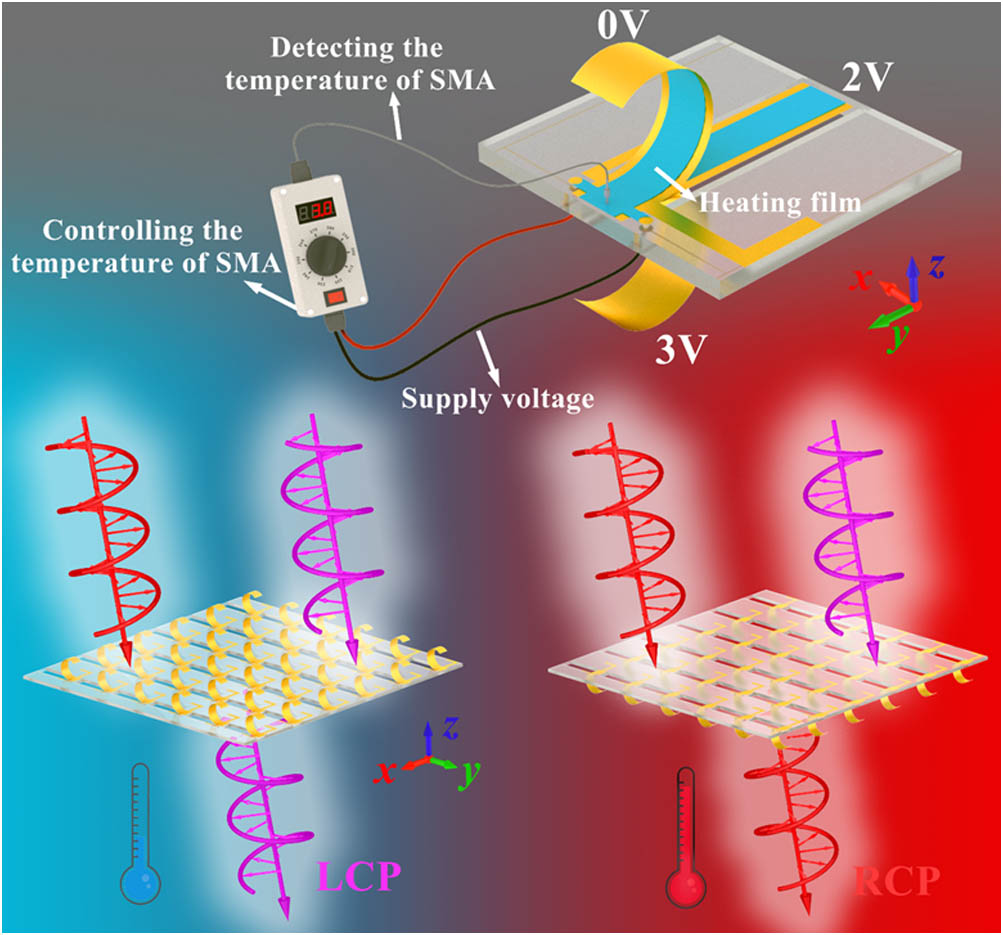
Fig. 1. Schematic diagram of the voltage-controlled 3D reconfigurable chiral metamaterial. The SMA is covered with a 0.1 mm thick insulating heating film, as shown in the blue part between the feeding vias and the SMA. The DC voltage source adjusts the voltage loaded on the heating film to achieve temperature control by detecting the difference between the temperature of the SMA and the target temperature.
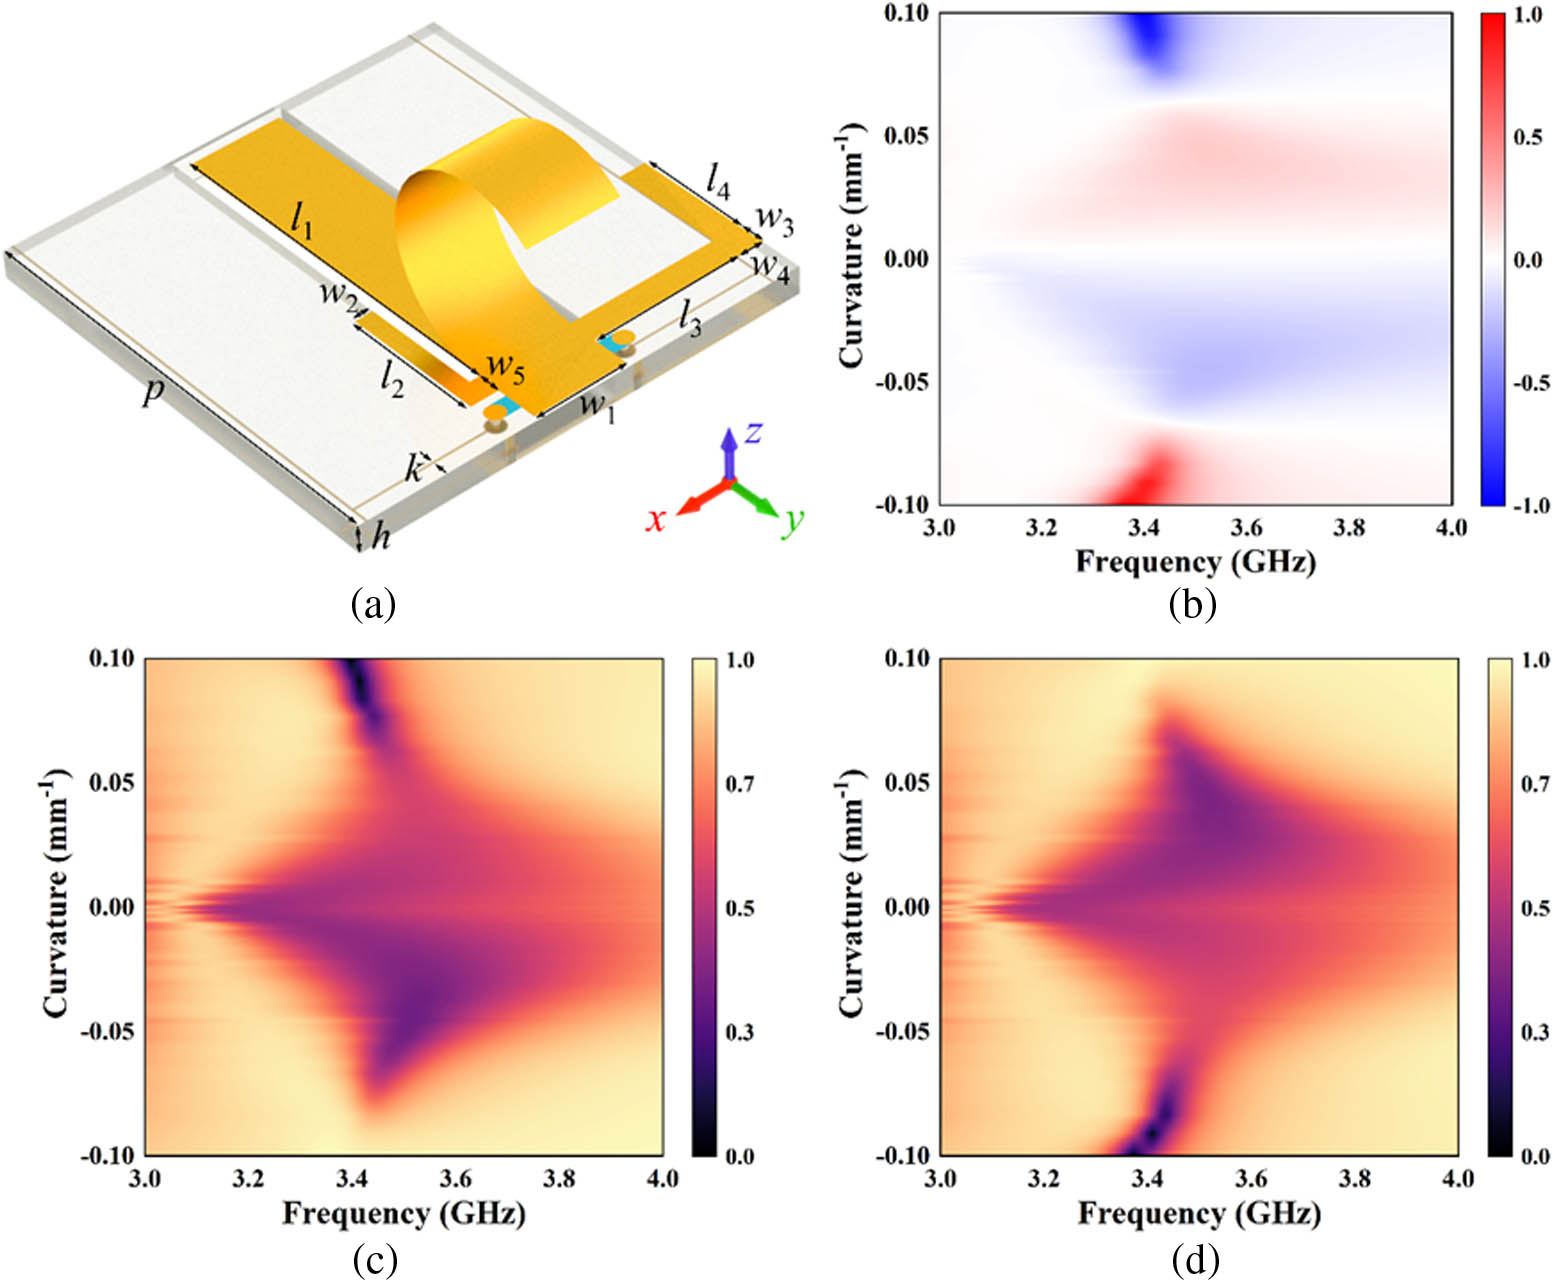
Fig. 2. Schematic diagram of the meta-atom and its transmission spectrum. (a) Schematic of the meta-atom; the optimized parameters are p = 48 mm l 1 = 39 mm w 1 = 10 mm l 2 = 15 mm w 2 = 2 mm l 3 = 16 mm w 3 = 3 mm l 4 = 12 mm w 4 = 3 mm w 5 = 2.5 mm k = 0.2 mm h = 1 mm + z − z
Fig. 3. Surface current distribution when (a) 1 / ρ = + 0.1 1 / ρ = 0 1 / ρ = − 0.1 1 / ρ = + 0.1 1 / ρ = 0 1 / ρ = − 0.1 log 10 | E |
Fig. 4. Surface current distribution. The surface current direction under (a) RCP wave incidence and (b) LCP wave incidence. The surface current intensity under (c) RCP wave incidence and (d) LCP wave incidence.
Fig. 5. Amplitudes of the power scattered by multipole moments. Power scattered by multipole moments under RCP wave incidence when (a) 1 / ρ = + 0.1 1 / ρ = 0 1 / ρ = − 0.1 1 / ρ = + 0.1 1 / ρ = 0 1 / ρ = − 0.1
Fig. 6. (a) Measurement setup. Simulated and measured transmission performance under LCP and RCP waves incidence when (b) 1 / ρ = − 0.1 1 / ρ = 0 , 1 / ρ = + 0.1
Fig. 7. Simulated transmission spectra of (a) t LR t RL
Fig. 8. (a) SMA’s curvature varies with time. (b) Transmission coefficient of the meta-atom with and without feeding lines. Simulated and measured transmission performance under LCP and RCP waves incidence when (c) 1 / ρ = − 0.4 1 / ρ = + 0.4
Fig. 9. The power scattered by Q under RCP wave incidence when (a) 1 / ρ = + 0.1 1 / ρ = - 0.1 Q under LCP wave incidence when (c) 1 / ρ = + 0.1 1 / ρ = - 0.1

Set citation alerts for the article
Please enter your email address
© Copyright 2018-2021 | Chinese Laser Press. All Rights Reserved 沪ICP备15018463号-20