• Spectroscopy and Spectral Analysis
  • Vol. 42, Issue 3, 776 (2022)
Yong-tian REN*, Yi HU, Jun CHEN, and Jun CHEN*;
Author Affiliations
  • Science and Technology on Surface Physics and Chemistry Laboratory, China Academy of Engineering Physics, Mianyang 621908, China
  • show less
    DOI: 10.3964/j.issn.1000-0593(2022)03-0776-07 Cite this Article
    Yong-tian REN, Yi HU, Jun CHEN, Jun CHEN. Study on Compressed Sensing Method for Raman Spectroscopic Analysis of Isotope Hydrogen Gas[J]. Spectroscopy and Spectral Analysis, 2022, 42(3): 776 Copy Citation Text show less
    (a) Simulated spectrum; (b) Simulated spectrum with noise; (c) Reconstructed spectrum by FTOMP; (d) Reconstructed spectrum by LoOMP; (e) Denoising spectrum with Wavelet soft threshold; (f) Denoising spectrum with Wavelet hard threshold; (g) SG filtered spectrum
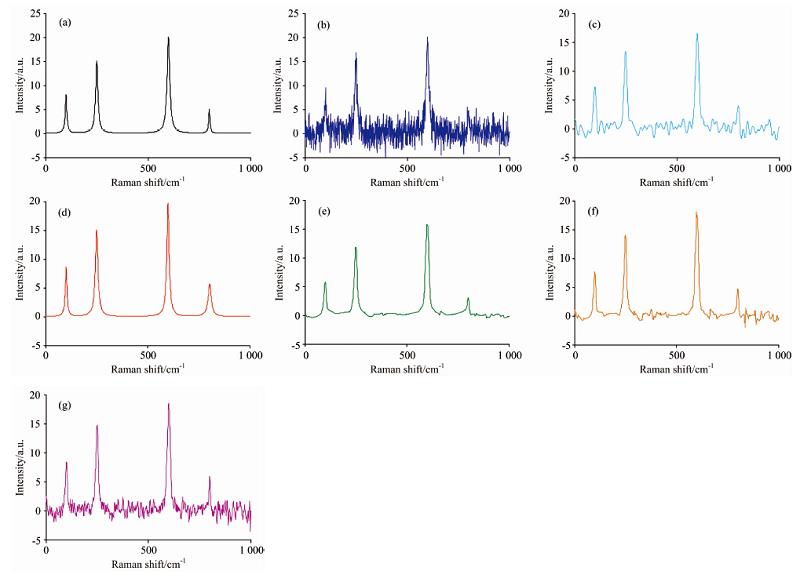
    Fig. 1. (a) Simulated spectrum; (b) Simulated spectrum with noise; (c) Reconstructed spectrum by FTOMP; (d) Reconstructed spectrum by LoOMP; (e) Denoising spectrum with Wavelet soft threshold; (f) Denoising spectrum with Wavelet hard threshold; (g) SG filtered spectrum
    Compressed sensing method to reconstruct the signal(a): M/N-SNR curves; (b): M/N-RMSE curves; (c): K-SNR curves; (d): K-RMSE curves
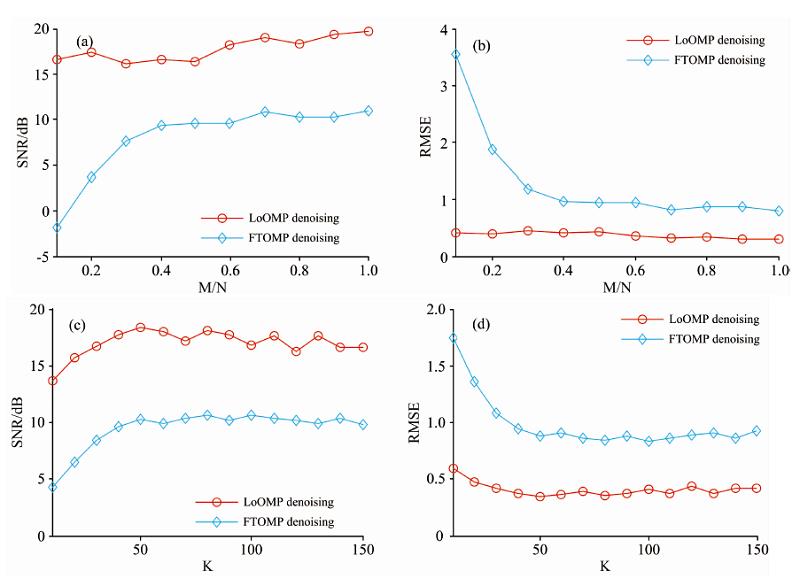
    Fig. 2. Compressed sensing method to reconstruct the signal
    (a): M/N-SNR curves; (b): M/N-RMSE curves; (c): K-SNR curves; (d): K-RMSE curves
    Raman spectrum of H2 and D2 mixed gas with 1 s collection time
    Fig. 3. Raman spectrum of H2 and D2 mixed gas with 1 s collection time
    (a) Raman spectrum of H2 and D2 mixed gas with 1 s collection time; (b) Reconstructed spectrum by FTOMP; (c) Reconstructed spectrum by LoOMP; (d) Denoising spectrum by Wavelet soft threshold; (e) Denoising spectrum by Wavelet hard threshold; (f) SG filtered spectrum
    Fig. 4. (a) Raman spectrum of H2 and D2 mixed gas with 1 s collection time; (b) Reconstructed spectrum by FTOMP; (c) Reconstructed spectrum by LoOMP; (d) Denoising spectrum by Wavelet soft threshold; (e) Denoising spectrum by Wavelet hard threshold; (f) SG filtered spectrum
    The difference in the D2 signal intensity by LoOMP and FTOMP(a): Intensity error of D2 signal vs M/N value; (b): Intensity error of D2 signal vs K value
    Fig. 5. The difference in the D2 signal intensity by LoOMP and FTOMP
    (a): Intensity error of D2 signal vs M/N value; (b): Intensity error of D2 signal vs K value
    The difference in the D2 signal intensity by LoOMP and FTOMP(a): Intensity of D2 signal vs collection time; (b): Intensity error of D2 signal vs collection time
    Fig. 6. The difference in the D2 signal intensity by LoOMP and FTOMP
    (a): Intensity of D2 signal vs collection time; (b): Intensity error of D2 signal vs collection time
    NumberPeak positionAmplitudeFull width at half max
    1100810
    22501514
    36002016
    480058
    Table 1. Parameters of only simulated Raman signal
    NumberPeak positionAmplitudeFull width at half max
    11008.639.74
    225015.0814.11
    360019.7015.93
    48005.698.65
    Table 2. Parameters of reconstructed Raman signals by LoOMP
    originalLoOMPWavelet soft thresholdWavelet hard thresholdSGFTOMP
    SNR4.287 418.374 315.417 414.898 110.666 610.274 8
    RMSE1.747 50.345 20.485 20.515 10.838 40.877 1
    Table 3. SNR and RMSE before and after processing the treatments of the simulated noisy Raman spectrum
    LoOMPWavelet soft thresholdWavelet hard thresholdSGFTOMP
    Intensity error-0.098 10.371 60.105 60.088 30.524 9
    Table 4. The difference in the D2 signal intensity by the five methods
    Yong-tian REN, Yi HU, Jun CHEN, Jun CHEN. Study on Compressed Sensing Method for Raman Spectroscopic Analysis of Isotope Hydrogen Gas[J]. Spectroscopy and Spectral Analysis, 2022, 42(3): 776
    Download Citation