• Photonics Research
  • Vol. 12, Issue 1, 141 (2024)
Yuan Wang*, Pedro Tovar, Juntong Yang, Liang Chen, and Xiaoyi Bao
Author Affiliations
  • Nexus for Quantum Technologies, University of Ottawa, Ottawa, Ontario K1N 6N5, Canada
  • show less
    DOI: 10.1364/PRJ.497955 Cite this Article Set citation alerts
    Yuan Wang, Pedro Tovar, Juntong Yang, Liang Chen, Xiaoyi Bao. Distributed phase-matching measurement for dynamic strain and temperature sensing based on stimulated Brillouin scattering enhanced four-wave mixing[J]. Photonics Research, 2024, 12(1): 141 Copy Citation Text show less
    (a) Working principle of Brillouin-enhanced four-wave mixing (BEFWM) in PMF. (b) Optical frequency relationship between the four optical waves in the PMF. (c) Energy diagram of BEFWM. νp: pump wave; νS: Stokes wave; νpro: probe wave; νi: idler wave; νB: Brillouin frequency shift; and νBire(t,z): birefringence-induced frequency separation for position z at time t.
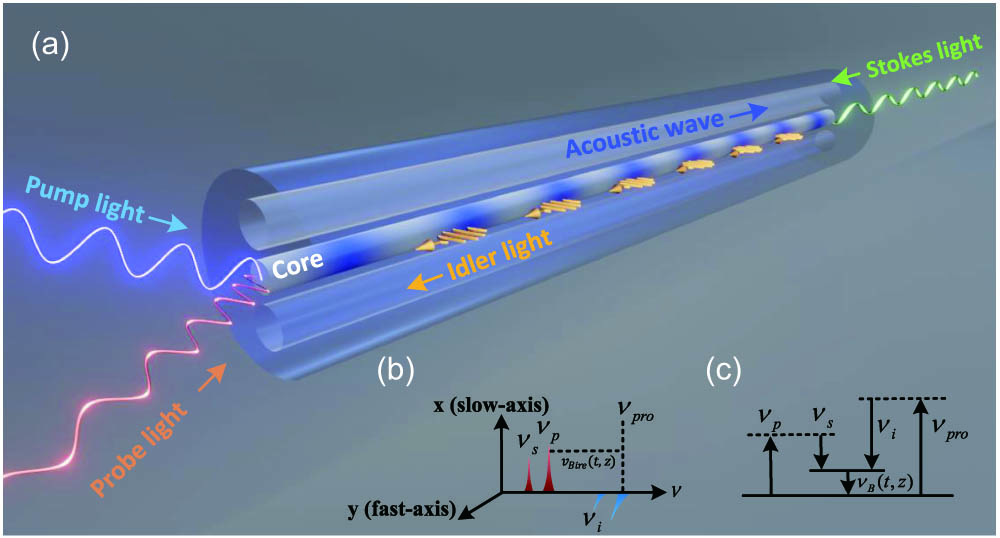
    Fig. 1. (a) Working principle of Brillouin-enhanced four-wave mixing (BEFWM) in PMF. (b) Optical frequency relationship between the four optical waves in the PMF. (c) Energy diagram of BEFWM. νp: pump wave; νS: Stokes wave; νpro: probe wave; νi: idler wave; νB: Brillouin frequency shift; and νBire(t,z): birefringence-induced frequency separation for position z at time t.
    Principle of distributed birefringence variation-induced time delay measurement in a Brillouin dynamic grating.
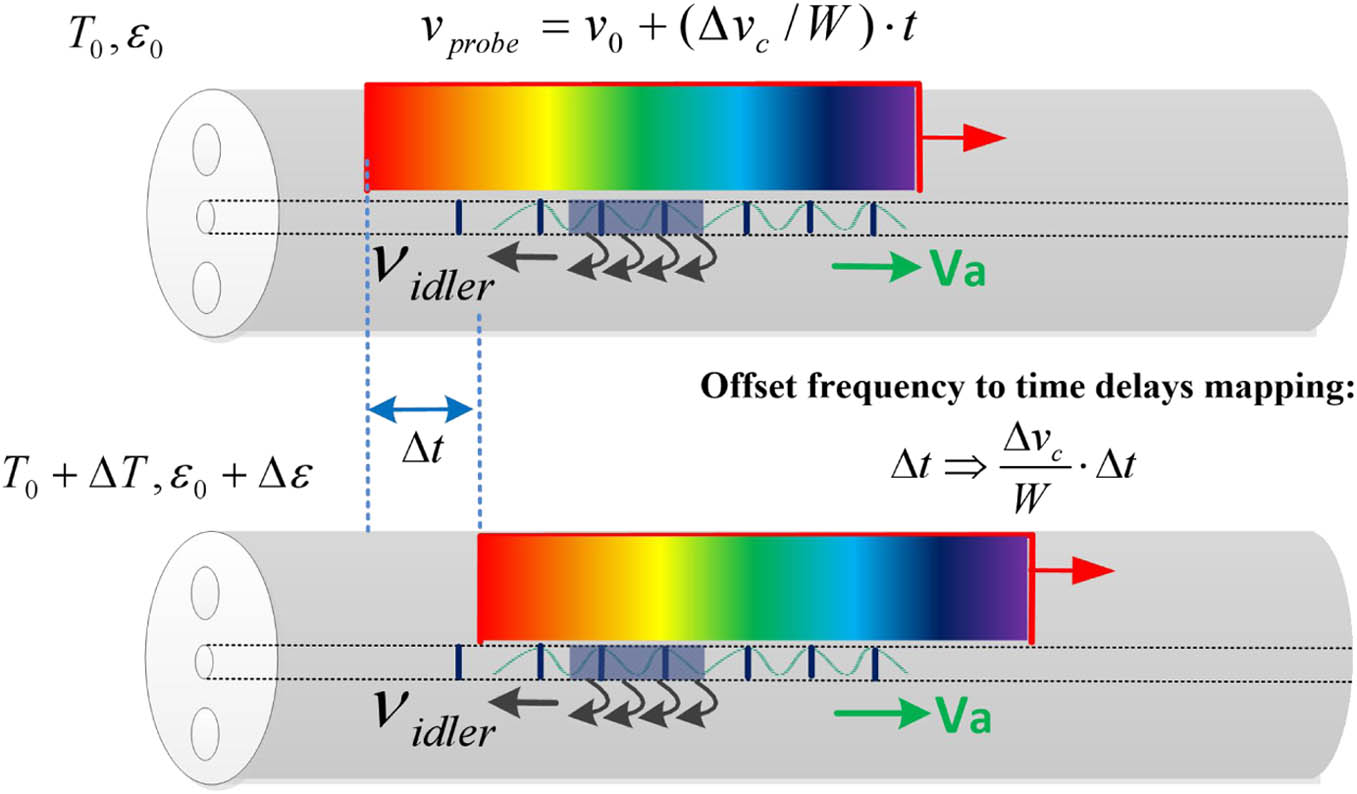
    Fig. 2. Principle of distributed birefringence variation-induced time delay measurement in a Brillouin dynamic grating.
    Backscattering signal of a probe wave from the BDG in the (a) spectral and (b) time domains. In (b), there also is a comparison of the time domain signal with and without frequency chirping.
    Fig. 3. Backscattering signal of a probe wave from the BDG in the (a) spectral and (b) time domains. In (b), there also is a comparison of the time domain signal with and without frequency chirping.
    (a) 2D amplitude map (with interpolation algorithm) of the time domain idler traces with temperature changes applied from 1 to 11 m. Idler traces (b) under different temperatures applied and (c) without temperature changes.
    Fig. 4. (a) 2D amplitude map (with interpolation algorithm) of the time domain idler traces with temperature changes applied from 1 to 11 m. Idler traces (b) under different temperatures applied and (c) without temperature changes.
    (a) Recovered time-delay along the fiber. (b) Temperature measurement linearity with the same temperature variations but different time window lengths. (c) Time-delay relationship with the applied temperature at the 2 m location. (d) Time-delay statistics obtained from an undisturbed fiber section, indicating a noise equivalent temperature variation of 5.6 mK.
    Fig. 5. (a) Recovered time-delay along the fiber. (b) Temperature measurement linearity with the same temperature variations but different time window lengths. (c) Time-delay relationship with the applied temperature at the 2 m location. (d) Time-delay statistics obtained from an undisturbed fiber section, indicating a noise equivalent temperature variation of 5.6 mK.
    (a) 2D intensity map of the idler traces in the time domain with a strain change from 0 to 20 με. (b) Relationship between applied strain variations and time delays. (c) Strain distribution along the PMF. (d) Noise equivalent strain variations.
    Fig. 6. (a) 2D intensity map of the idler traces in the time domain with a strain change from 0 to 20 με. (b) Relationship between applied strain variations and time delays. (c) Strain distribution along the PMF. (d) Noise equivalent strain variations.
    (a) 2D intensity map of the idler traces with dynamic strain variations applied. (b) Demodulated dynamic strain variations profile in the 5–6 m section. (c) Dynamic strain variations measurement with a peak-to-peak amplitude of 2 με and (d) its FFT analysis.
    Fig. 7. (a) 2D intensity map of the idler traces with dynamic strain variations applied. (b) Demodulated dynamic strain variations profile in the 5–6 m section. (c) Dynamic strain variations measurement with a peak-to-peak amplitude of 2 με and (d) its FFT analysis.
    (a) BDG reflection signal with different chirping rates. (b) Relationship between the number of peaks/signal contrast and the chirping rate. (c) Static strain distribution along with the fiber.
    Fig. 8. (a) BDG reflection signal with different chirping rates. (b) Relationship between the number of peaks/signal contrast and the chirping rate. (c) Static strain distribution along with the fiber.
    Illustration of the birefringence property in the PMF.
    Fig. 9. Illustration of the birefringence property in the PMF.
    Experimental setup for distributed temperature and strain sensing based on BDG detection in the PMF. DFB laser: distributed feedback laser; SOA: semiconductor optical amplifier; EDFA: erbium-doped optical fiber amplifier; PC: polarization controller; PBS: polarization beam splitter; NLL: narrow linewidth laser; PG: pulse generator; OBPF: optical bandpass filter; PD: photodetector; and OSC: oscilloscope.
    Fig. 10. Experimental setup for distributed temperature and strain sensing based on BDG detection in the PMF. DFB laser: distributed feedback laser; SOA: semiconductor optical amplifier; EDFA: erbium-doped optical fiber amplifier; PC: polarization controller; PBS: polarization beam splitter; NLL: narrow linewidth laser; PG: pulse generator; OBPF: optical bandpass filter; PD: photodetector; and OSC: oscilloscope.
    Simulation results of changing the pump-probe frequency offset (νBire) without temperature/strain variations applied. (a) 2D intensity map of the idler signal with frequency offset variations of 0–192 MHz. (b) Idler signal in a window of 1.5–3 m with different frequency offset variations. The relationship between frequency offset changes and time delays when different chirping rates are used: (c) 44.8 MHz/ns and (d) 30.2 MHz/ns.
    Fig. 11. Simulation results of changing the pump-probe frequency offset (νBire) without temperature/strain variations applied. (a) 2D intensity map of the idler signal with frequency offset variations of 0–192 MHz. (b) Idler signal in a window of 1.5–3 m with different frequency offset variations. The relationship between frequency offset changes and time delays when different chirping rates are used: (c) 44.8 MHz/ns and (d) 30.2 MHz/ns.
    Yuan Wang, Pedro Tovar, Juntong Yang, Liang Chen, Xiaoyi Bao. Distributed phase-matching measurement for dynamic strain and temperature sensing based on stimulated Brillouin scattering enhanced four-wave mixing[J]. Photonics Research, 2024, 12(1): 141
    Download Citation