• Photonics Research
  • Vol. 12, Issue 1, 141 (2024)
Yuan Wang*, Pedro Tovar, Juntong Yang, Liang Chen, and Xiaoyi Bao
Author Affiliations
  • Nexus for Quantum Technologies, University of Ottawa, Ottawa, Ontario K1N 6N5, Canada
  • show less
    DOI: 10.1364/PRJ.497955 Cite this Article Set citation alerts
    Yuan Wang, Pedro Tovar, Juntong Yang, Liang Chen, Xiaoyi Bao. Distributed phase-matching measurement for dynamic strain and temperature sensing based on stimulated Brillouin scattering enhanced four-wave mixing[J]. Photonics Research, 2024, 12(1): 141 Copy Citation Text show less

    Abstract

    A Brillouin dynamic grating (BDG) can be used for distributed birefringence measurement in optical fibers, offering high sensitivity and spatial resolution for sensing applications. However, it is quite a challenge to simultaneously achieve dynamic measurements with both high accuracy and high spatial resolution. In this work, we propose a sensing mechanism to achieve distributed phase-matching measurement using a chirped pulse as a probe signal. In BDG reflection, the peak reflection corresponds to the highest four-wave mixing (FWM) conversion efficiency, and it requires the Brillouin frequency in the fast and slow axes to be equal, which is called the phase-matching condition. This condition changes at different fiber positions, which requires a range of frequency injection for the probe wave. The proposed method uses a chirped pulse as a probe wave to cover this frequency range associated with distributed birefringence inhomogeneity. This allows us to detect distributed phase matching for birefringence changes that are introduced by temperature and strain variations. Thanks to the single shot and direct time delay measurement capability, the acquisition rate in our system is only limited by the fiber length. Notably, unlike conventional BDG spectrum recovery-based systems, the spatial resolution here is determined by both the frequency chirping rate of the probe pulse and the birefringence profile of the fiber. In the experiments, an acquisition rate of 1 kHz (up to fiber length limits) and a spatial resolution of 10 cm using a 20 ns probe pulse width are achieved. The minimum detectable temperature and strain variation are 5.6 mK and 0.37 με along a 2 km long polarization-maintaining fiber (PMF).

    1. INTRODUCTION

    The process of four-wave mixing (FWM) involving acoustically coupled optical waves from stimulated Brillouin scattering (SBS) was first studied in the 1980s, showing extremely large reflectivities under the right conditions (phase/frequency matching) [1,2]. In this process, the interaction between two optical waves with a frequency difference matching the Brillouin frequency generates an acoustic wave, which modulates the medium’s refractive index scattering light from a third optical wave (probe), resulting in the generation of a conjugated wave (idler). This fourth wave can be generated with high efficiency if the phase matching between the optical and acoustic waves is satisfied, which can be interpreted as a strong reflection from the third optical wave. This phenomenon is known as Brillouin-enhanced four-wave mixing (BEFWM), and it has been observed in different media. The fiber waveguide version of this physics process is often realized in polarization-maintaining fibers (PMFs) [3,4], which has gained significant attention as it translates into a method to measure the Brillouin dynamic grating (BDG) induced by the acoustic wave.

    Since the initial proof-of-concept experiment on all-optical dynamic gratings using stimulated Brillouin scattering (SBS), which achieved a reflectance of 4% in a 30 m Panda-type PMF [3], BDGs have been extensively studied. This includes theoretical model analysis [5,6] and demonstrations of BDG operation in various media such as single-mode fibers [7,8], elliptical core two-mode fibers [9], few-mode fibers [10], and dispersion-shifted fibers [11]. Furthermore, BDG-based distributed sensing has garnered considerable attention as the sensitivity of the BDG spectrum to temperature and strain is significantly higher compared to the Brillouin gain spectrum, owing to the highly sensitive birefringence change of the fast axis and the slow axis of PMFs [12]. Therefore, by scanning the probe wave frequency to measure the BDG intensity spectrum through detection of the idler wave, the birefringence of PMFs is readily obtained [13,14]. The first measurement of strain/temperature-induced birefringence variations based on BDG spectrum recovery was demonstrated in Ref. [15]. The idler intensity reflects the efficiency of phase matching of BEFWM, which is directly related to the refractive index difference between the fast axis and the slow axis. The BEFWM-based technique can achieve a high spatial resolution in the centimeters range by obtaining the Brillouin gain spectrum without a broadening effect for distributed sensing [4,16,17]. Besides, there are some works focused on extending BDG-based sensing to achieve dynamic measurements. For instance, one method described in Refs. [18,19] uses a slope-assisted technique to convert the BDG spectrum shift to optical power measurement, enabling dynamic strain measurement with vibration frequencies up to kHz. However, the sensing accuracy in this approach is mainly limited by the measurand dependence on the local optical power, which impairs the performance. In addition, the probe coding technique [20] can improve the signal-to-noise ratio and measurement speed in BDG-based distributed sensing, but it requires coherent detection. In addition, the Brillouin frequency shift and the birefringence change exhibit the same signs for strain dependence, but opposite signs for temperature dependence, which can be used to discriminate the temperature and strain variations with higher accuracy [15,21,22].

    For optimal efficiency, the pump signal, Stokes wave, probe wave, and idler wave must satisfy the phase-matching condition Δk=(kp+kS)(kpro+ki)=0, which depends on the effective refractive index difference between the two polarization axes. Thus, instead of recovering the gain spectrum by sweeping the probe frequency to obtain the birefringence variations, the distributed phase-matching conditions are measured along the fiber length without an intensity fading problem. In this paper, we propose a BDG-based sensing technique. The principle relies on the delay time spectrum correlation shift between two subsequent measurements, providing for the first time, to the best of our knowledge, a single-shot measurement for birefringence variations. In contrast to the conventional method of precisely tuning the frequency difference between pump and probe in the orthogonal axis, our method is based on the distributed phase-matching condition measurement in the two axes of the PMF, thus avoiding the laser frequency scanning required for interrogation and hence significantly improving the acquisition rate. Furthermore, our proposed technique also enables higher spatial resolution by using pulses with fast chirping rates. The higher resolution comes from the fact that phase matching is only achieved at a narrow interval of the chirped pulse, so that phase matching is satisfied in a scale much smaller than the pulse width, allowing precise measurements with an enhanced spatial resolution. As a result, an acquisition rate of 1 kHz is used to measure an applied dynamic strain of 1 Hz with a peak-to-peak amplitude of 2 με. It is noted that the highest measurable vibration frequency is only limited by the fiber length. Another limiting factor could be the averaging number of multiple traces, which may be required to improve the signal-to-noise ratio, but is not a physical limitation. A high spatial resolution of 10 cm is achieved by sending 20 ns pulses with a frequency chirping rate of 93.5 MHz/ns. The measurement spatial resolution is defined by small time windows that are used to calculate the cross-correlation between subsequent traces to extract the peak shifts of the BDG spectrum in PMF. The minimum detectable temperature and strain variations are up to 5.6 mK and 0.37 με.

    2. METHOD

    A. Principle of BDG Generation and Detection in PMFs

    The principle of BDG generation and detection in PMFs involves four light waves interacting through material density variations (acoustic wave) among the two polarization axes, as shown in Fig. 1(a). The BDG is generated by injecting two continuous optical waves (pump νp and Stokes νS) into the same axis (e.g., the slow axis) of a PMF from opposite ends. Once the frequency difference between the pump and Stokes waves is tuned to match the Brillouin frequency shift of that axis, an acoustic wave will be excited through electrostriction, thereupon producing a BDG. The propagation direction of the BDG is the same as that of the pump wave. To detect the BDG, a probe wave (νpro) is sent to the PMF from the same end as the pump wave but in the orthogonal axis (the fast axis). Due to the strict phase-matching condition requirements, the frequency separation between the probe and pump waves must be carefully set to generate the idler wave (νi), which propagates along the same direction as the Stoke wave but in the orthogonal axis. The frequency distribution of the four optical waves and their propagation axis are shown in Fig. 1(b). The diffracted idler wave has a lower frequency compared to the probe wave, their difference being equal to the local BFS at given time t, νB(t,z)=νpνs=νproνi, as shown in Fig. 1(c). In case the pump and probe waves are launched in the form of optical pulses, the information of the fiber’s distributed birefringence will be carried by the intensity of the idler wave, which depends on the local frequency offset between the pump and probe waves, νBire=νproνp. It is crucial to mention that although the pump and probe pulses propagate in the same direction, their group velocity is different due to the different refractive indexes in the fast axis and slow axis of the PMF, which leads to a severe walk-off over a long PMF. For example, the time delay between two pulses launched into the orthogonal axis of a 10 km long PMF with birefringence of 6×10⁴ is about 20 ns [14]. To avoid this problem, the pump wave is CW in our experiments.

    (a) Working principle of Brillouin-enhanced four-wave mixing (BEFWM) in PMF. (b) Optical frequency relationship between the four optical waves in the PMF. (c) Energy diagram of BEFWM. νp: pump wave; νS: Stokes wave; νpro: probe wave; νi: idler wave; νB: Brillouin frequency shift; and νBire(t,z): birefringence-induced frequency separation for position z at time t.

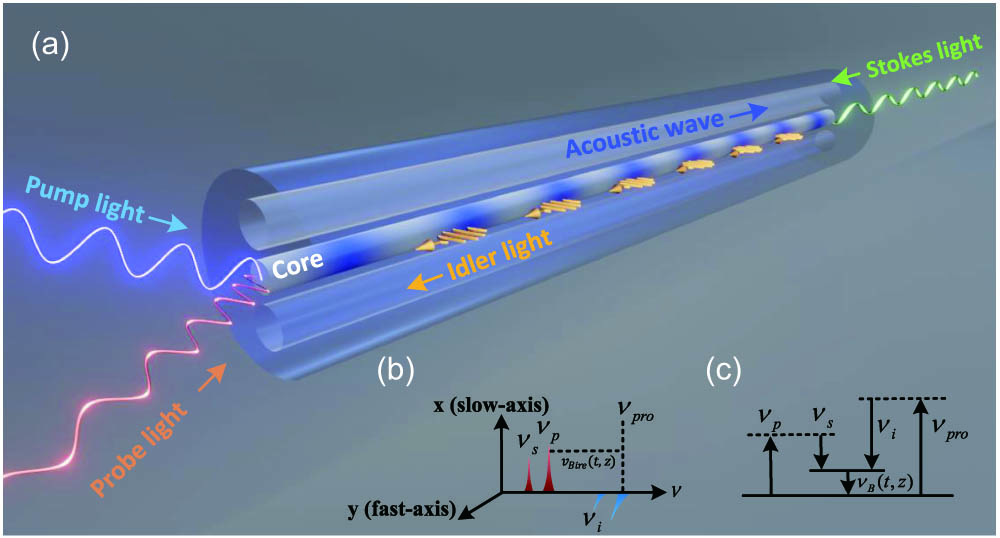
    Figure 1.(a) Working principle of Brillouin-enhanced four-wave mixing (BEFWM) in PMF. (b) Optical frequency relationship between the four optical waves in the PMF. (c) Energy diagram of BEFWM. νp: pump wave; νS: Stokes wave; νpro: probe wave; νi: idler wave; νB: Brillouin frequency shift; and νBire(t,z): birefringence-induced frequency separation for position z at time t.

    The interaction between the four waves in the PMF can be regarded as a four-wave mixing process. When the frequency difference between the pump and Stokes waves matches the Brillouin frequency of the slow axis exciting an acoustic wave, the longitudinal acoustic mode couples the optical waves in the orthogonal polarization axis, so that the four optical waves are coupled through [6] Apz=η(Ap|AS|2+ASAproAi*exp(iΔk(z)z)),ASz=η(AS|Ap|2+ApAiApro*exp(iΔk(z)z)),Aproz=η(Apro|Ai|2+ApAiAS*exp(iΔk(z)z)),Aiz=η(Ai|Apro|2+ASAproAp*exp(iΔk(z)z)),where the system is assumed to be under steady state, and Ap, AS, Apro, and Ai are the slowly varying optical fields. Δk(z) is the phase mismatch related to the frequency difference between the pump and probe waves, which is proportional to the local birefringence of the fiber. The coupling constant η is given by η=8π3γe2ρ0cλp3ΩBΓBAeffao,with the acousto-optic effective area of Aeffao=(F2(x,y)F2(x,y)FA(x,y))FA2(x,y),where F(x,y) is the dimensionless fundamental mode profile for the four optical waves, FA(x,y) is the dimensionless mode profile of the acoustic wave, and angular brackets denote averaging over the transverse cross-section of the fiber. γe is the electrostrictive constant, ρ0 is the average material density, c is the velocity of light in vacuum, λp is the operation wavelength of the pump wave, and ΓB is the Brillouin linewidth. By solving Eqs. (1)–(4), since Ai is the only optical wave generated in the process (not pre-launched in the fiber), its intensity is strongly dependent on the phase-matching term, and thus proportional to the fiber’s birefringence. Therefore, by detecting the power of the idler wave, the birefringence of the fiber is readily obtained. However, as the phase-matching term depends on the frequency separation between pump and probe waves, a complete characterization of the birefringence requires the scanning of νpro, which is time-consuming and prevents dynamic birefringence measurement. Next, we will discuss the principle of dynamic birefringence measurement by using chirped pulses as the probe wave.

    B. Birefringence Variations to Time Delay Mapping

    The principle of birefringence change measurement in a PMF via BEFWM with chirped pulses for temperature/strain sensing is illustrated in Fig. 2. Assume that the probe signal for BDG detection in the fast axis has a linearly chirped frequency profile with an instantaneous frequency of νpro(t)=ν0+R·t,R=Δνc/W,where ν0 is the initial optical frequency, R is the frequency chirping rate, W is the pulse width, and Δνc is the frequency chirping range. In Fig. 2, we compare the phase-matching condition for a given fiber section (transparent blue) under different strain and temperature conditions T0,ε0 and T0+ΔT, ε0+Δε. In the top figure, the fiber section under test is at temperature T0 and strained by ε0, while in the bottom figure it is at temperature T0+ΔT and strained by ε0+Δε. At given time t0 in the top figure, the chirped pulse propagates along the fiber and covers the fiber section, in which the frequency components of a narrow spectral band (green band) align with the local birefringence-induced frequency offset between the pump and probe waves, and fall within the BDG gain spectrum, thus satisfying the phase-matching condition. As a result, only the photons from this narrow energy band are reflected by the BDG, leading to an intensity peak at the idler wave that arises from the interaction of each frequency component with the BDG. For comparison, at given time t0+Δt in the bottom figure, which represents a subsequent measurement shot, the temperature and strain variations (ΔT and Δε) applied to the fiber section will affect the birefringence, and thus the phase-matching condition will be satisfied at a different frequency band (yellow band) for the same fiber section. Since the narrow frequency band satisfying the phase-matching condition at t0+Δt occurs at a delayed time compared to the case at time t0 (i.e., the yellow band is delayed from the green band), then the same intensity profile observed at the idler power will be time delayed.

    Principle of distributed birefringence variation-induced time delay measurement in a Brillouin dynamic grating.

    Figure 2.Principle of distributed birefringence variation-induced time delay measurement in a Brillouin dynamic grating.

    Assuming a linear chirp according to Eq. (8), the birefringence-induced time delays observed in the backscattered idler trace will be proportional to the birefringence variations. Therefore, if the chirping range is large enough to compensate for the variations of νBire induced by birefringence changes due to temperature/strain variations, then by mapping the local time delays into birefringence changes one can readily perform birefringence change sensing. For a distributed measurement, the backscattered idler trace is divided into narrow time windows. By correlating the idler traces from two subsequent measurements at the same time window (corresponding to the same location z), the local time delay is obtained. Note that since the narrow bands satisfying the phase-matching condition correspond to a small fraction of the pulse duration, the measurement spatial resolution can be much shorter than the pulse width, and it is actually defined by the duration of the time windows chosen for the correlation calculation. The mapping from time delay (Δt) to temperature/strain variation-induced birefringence change (ΔB) is given by ΔBz(ΔT,Δε)=Δνc·ngyW·νp·Δtz(ΔT,Δε),where ΔBz(ΔT,Δε) is the birefringence change at position z between two subsequent measurements at temperature/strain variations of ΔT and Δε, and ngy is the group refractive index in y axis. The derivation of Eq. (9) is found in Appendix A.

    3. RESULTS AND DISCUSSIONS

    A. Frequency and Time Domain Responses of the Brillouin Dynamic Grating

    The comprehensive experimental setup employed in this study, encompassing chirped pulse generation, BDG generation, and idler signal detection, is detailed in Appendix B. As described above, three lightwaves were launched into the fiber: the pump wave (slow axis), the Stokes wave (slow axis), and the chirped pulse as a probe wave (fast axis). We first measured the backscattered power spectrum in the fast axis in an optical spectrum analyzer (OSA) to verify the BDG reflection signal in frequency domain. As depicted in Fig. 3(a), when the pump and Stokes waves are not launched into the fiber, only the Rayleigh backscattered light from chirped pulses is observed. The power of the probe wave is set to a low level to prevent the generation of spontaneous Brillouin scattering, thereby avoiding the generation of Stokes light at the same frequency as the idler signal. When the pump and Stokes waves are included in the system, the measured signal in the fast axis is the nonpolarized endface reflection from the connection between the PBS and PMF, giving a distinct peak in the fast axis at pump frequency. Even though the pump is launched into the slow axis, the generated spontaneous Brillouin scattering with random polarization allows Stokes light to be detected in the orthogonal axis, as observed in Fig. 3(a).

    Backscattering signal of a probe wave from the BDG in the (a) spectral and (b) time domains. In (b), there also is a comparison of the time domain signal with and without frequency chirping.

    Figure 3.Backscattering signal of a probe wave from the BDG in the (a) spectral and (b) time domains. In (b), there also is a comparison of the time domain signal with and without frequency chirping.

    The intense generation of BDG results in a reflection signal (idler) exhibiting a frequency separation of νB from the probe signal in the fast axis. Figure 3(b) shows the detection of the idler signal in time domain under two different conditions: launching unchirped pulses (external modulation of CW laser light), and launching chirped pulses. Both traces exhibit a notable decrease in intensity due to pump depletion. The idler signal generated from unchirped pulses exhibits multiple intensity fading sections, wherein the detected power is reduced to nearly zero, as depicted in the zoomed-in inset in the positions ranging from 240 to 250 m. The intensity fading section in the idler signal from unchirped pulses is attributed to the position-dependent birefringence along the PMF. Small birefringence variations caused by the inherent inhomogeneity of the PMF result in the breaking of the phase-matching condition; therefore, the unchirped pump pulses centered at fixed probe laser central frequency cannot achieve phase matching at all positions.

    To address this issue, a common approach is to sweep the central frequency of the unchirped pulses to obtain the frequency response at each position, and the spatially resolved birefringence profile can be determined by selecting the peak of the local BDG reflection spectrum. However, this solution usually takes a long time to reconstruct the birefringence profile, which reduces the sensing speed (system’s sampling rate) of the distributed dynamic sensing. The intensity fading problem is here solved by launching chirped pulses with a chirping range that covers the birefringence variation range along the fiber. This aspect is verified in the time domain trace shown by the orange curve in the inset of Fig. 3(b). Compared to the unchirped pulse with the same pulse width, the optical frequency components in the chirped pulse occupy a smaller time duration within the entire pulse width. This enables precise spectrum scanning within a time window that is narrower than the pulse width. The linearly chirped pulse can match the birefringence change (associated with the phase-matching condition of FWM) accurately in the spatial domain. This is the key to achieving a higher spatial resolution than the optical pulse width. Furthermore, even though the intensity fading problem is avoided with chirped pulses, the idler intensity still exhibits a jagged profile, which can be attributed to the rapid birefringence fluctuations along the fiber arising from its inherent inhomogeneity. As the chirped pulse propagates along the fiber, at different time instances (corresponding to different pulse locations), each frequency component interacts with the corresponding section of the fiber based on the local birefringence conditions. However, only a subset of these frequency components that satisfies the phase-matching condition will be reflected by BDG, resulting in a jagged time domain pattern due to the changing reflected frequency components caused by local birefringence variations.

    B. Distributed Temperature Sensing

    Prior to conducting the distributed temperature/strain measurement, experiments were performed to verify the linear correspondence between time delays and pump–probe frequency offset changes (δνBire), and also to accurately characterize the frequency chirping rate of the probe pulses. The experimental details and results are detailed in Appendix C, where the linear correspondence was validated for two different chirped pulses with chirping rates of 44.8 and 30.2 MHz/ns, which were employed in the experiments detailed below.

    In the distributed temperature sensing experiment, the DFB laser frequency is initially tuned to achieve a suitable pump-probe frequency offset (νBire) around 92.8 GHz, which corresponds to the average birefringence along a 20 m PMF. A 10 m long fiber section is put under a water bath where the temperature was increased from 27°C to 27.9°C, while the remaining of the fiber is kept under room temperature. Figure 4(a) shows the amplitude variations of the idler signal along the fiber at different temperatures. It is observed that the amplitude oscillations remain constant for the fiber sections kept at room temperature, while the oscillation pattern changes for the section where the temperature was increased. This aspect is clear when analyzing the detected idler traces at four different temperatures for the section under the water bath [Fig. 4(b)], and under a stable room temperature [Fig. 4(c)].

    (a) 2D amplitude map (with interpolation algorithm) of the time domain idler traces with temperature changes applied from 1 to 11 m. Idler traces (b) under different temperatures applied and (c) without temperature changes.

    Figure 4.(a) 2D amplitude map (with interpolation algorithm) of the time domain idler traces with temperature changes applied from 1 to 11 m. Idler traces (b) under different temperatures applied and (c) without temperature changes.

    The temperature distribution is reconstructed as follows. The time delays are obtained by selecting a time window with a duration of 5 ns (corresponding to a fiber section of 0.5 m), followed by the calculation of cross-correlation at the same window between a reference trace and subsequent traces taken at different temperatures. The selected time window must cover at least one peak and it is limited by the birefringence-related intensity profile variation. The time window is moved from the beginning to the end; thus, the temperature distribution is reconstructed. This process is depicted in Fig. 5(a). The local time delays (frequency offset changes) are then used to directly resolve the temperature variation. Additionally, an error band is incorporated to illustrate the measured temperature uncertainty at each location. The main source of uncertainty and coefficient nonlinearity is attributed to the distortion of local time traces under temperature change due to stress rods with different thermal coefficients induced local birefringence change. This issue could be released by reducing the variation step between two single-shot measurements as shown in strain measurement results in next section, in which a finer variation step is applied. Increasing the time window size is another option. The larger time window of many different beat lengths in phase-matching conditions is equivalent to smoothing out the temperature-induced spatial dependence on birefringence, resulting in better accuracy at the cost of the spatial resolution, as shown in Fig. 5(b). Based on the frequency chirping rate of 44.8 MHz/ns in Fig. 11(c) of Appendix C, the theoretical coefficient between local time delay (Δtz) and temperature variations (ΔT) can be calculated according to Eq. (D1) in Appendix D and Eq. (A6) in Appendix A, which is given by ΔtzΔT=B0·W·νpΔνc·ngy·(Tfic25)=2.65  ns/°C,where B0 is the birefringence of the PMF sample at room temperature, ngy is the group refractive index in the y axis, W is the pulse width of the probe signal, νp is the optical frequency of the pump signal, Δνc is the frequency chirping range of the probe pulse, and Tfic denotes the fictive temperature (e.g., 850°C of silica glass). To demonstrate the linear relationship between the local time delays and the temperature variations, a time window of 5 ns is chosen at the 2 m location for each trace under varying temperatures, giving a coefficient of 2.46  ns/°C, as shown in Fig. 5(c), which is close to the theoretical value. The sensing accuracy is evaluated by the standard deviation of the time delay, which is assessed by comparing the idler trace of the undisturbed section at different times, resulting in a minimum detectable temperature variation of 5.6 mK, as shown in Fig. 5(d).

    (a) Recovered time-delay along the fiber. (b) Temperature measurement linearity with the same temperature variations but different time window lengths. (c) Time-delay relationship with the applied temperature at the 2 m location. (d) Time-delay statistics obtained from an undisturbed fiber section, indicating a noise equivalent temperature variation of 5.6 mK.

    Figure 5.(a) Recovered time-delay along the fiber. (b) Temperature measurement linearity with the same temperature variations but different time window lengths. (c) Time-delay relationship with the applied temperature at the 2 m location. (d) Time-delay statistics obtained from an undisturbed fiber section, indicating a noise equivalent temperature variation of 5.6 mK.

    C. Distributed Strain Sensing

    The distributed strain sensing capability is further demonstrated by subjecting a 1 m section of the PMF to stretching. One end of the stretched section is affixed to a fixed translation stage, while the other end is secured to a highly precise piezoelectric transducer (PZT) that can apply static or dynamic strain to the fiber section. First, static strain measurements were conducted, and Fig. 6(a) shows the 2D intensity map of idler traces with varying static strain applied. The figure clearly indicates longitudinal time shifts occurring around the section of 5–6 m in response to different static strain variations. The same post-processing procedure performed to reconstruct the temperature profile with cross-correlation between the time windows of subsequent traces is done here for strain recovery. As shown in Fig. 6(c), only the fiber sections from 5 to 6 m show significant strain variations, while other locations show small strain fluctuations from the system and environmental noises. The spatial resolution here is about 0.5 m, limited by the width of the selected time windows. The strain-induced time delay coefficient is also explored, as shown in Fig. 6(b), giving a sensitivity of 28.2 ps/με. Based on the frequency chirping rate characterization in Fig. 11(d) in Appendix C, the theoretical coefficient between the local time delay (Δtz) and the strain variations (Δε) can be calculated according to Eq. (D3) in Appendix D and Eq. (A6) in Appendix A, which is given by ΔtzΔε=B0·(γ3γ2)·W·νpΔνc·ngy·(α3α2)·(Tfic25)=37.4  ps/με,where α3  (α2) is the thermal coefficient of the stress-applying parts (pure silica cladding), and γ3  (γ2) is Poisson’s ratio of stress-applying parts (pure silica cladding). It is noted that the frequency chirping rate is decreased to 30.2 MHz/ns (1.2 GHz frequency chirping range and 40 ns pulse width) to obtain a larger strain variations-induced time delay coefficient. The difference between the experimental and theoretical coefficient values comes from the indetermination of the thermal contraction coefficient α and Poisson’s ratio γ.

    (a) 2D intensity map of the idler traces in the time domain with a strain change from 0 to 20 με. (b) Relationship between applied strain variations and time delays. (c) Strain distribution along the PMF. (d) Noise equivalent strain variations.

    Figure 6.(a) 2D intensity map of the idler traces in the time domain with a strain change from 0 to 20 με. (b) Relationship between applied strain variations and time delays. (c) Strain distribution along the PMF. (d) Noise equivalent strain variations.

    Finally, the strain measurement accuracy is evaluated from the nondisturbed region [Fig. 6(d)], which gives a standard deviation of strain variations of 0.37 με. The dynamic range of the proposed method is limited by the frequency chirping range of the pulse, but the measurable peak-to-peak amplitude can be relatively large with a higher sampling rate, depending on the variation frequency.

    In the dynamic strain measurement, three sinusoidal strain variations with peak-to-peak amplitudes of 10, 20, and 40 με, and a frequency of 1 Hz, are applied to a 1 m section of the PMF. The resulting changes in the intensity of the idler traces with respect to time and position are collected with an acquisition rate of 1 kHz (pulse repetition rate 1 kHz), and the results are depicted in Fig. 7(a). The choice of a 1 kHz repetition rate is constrained by the memory capacity of the oscilloscope, but it can be raised to the limits imposed by the fiber length. It clearly shows the peak of the idler traces around the 5 m section experiences sinusoidal time shifts, while the intensity of the traces in other sections remains unchanged. The strain variations near the 5 m location with different amplitudes applied are shown in Fig. 7(b), which is calculated from the local time delays between two consecutive traces through the cross-correlation calculation within the time window of 5 ns. The demodulated peak-to-peak strain amplitude agrees with the applied value with a relatively small uncertainty. To verify the minimum detectable strain variations, a 1 Hz sinusoidal strain variation with a peak-to-peak amplitude of 2 με is applied on the fiber, and the reconstructed signal with an interpolation algorithm in the idler traces is shown in Fig. 7(c). The use of an interpolation algorithm results in a higher density of data points for each idler trace, leading to an improved time delay measurement resolution. This, in turn, enhances the accuracy of the strain measurement and frequency resolution. The improvement with interpolation becomes evident when analyzing the frequency spectrum of the post-processed signal through a fast Fourier transform (FFT), as shown in Fig. 7(d). The demodulated signal obtained with the interpolation algorithm exhibits a higher signal-to-noise ratio (SNR), with significant suppression of noise peaks around 0.6 and 1.7 Hz. The highest measurable frequency in this proposed set is only limited by the sampling rate of the system, ultimately restricted by the light traveling time in the fiber length.

    (a) 2D intensity map of the idler traces with dynamic strain variations applied. (b) Demodulated dynamic strain variations profile in the 5–6 m section. (c) Dynamic strain variations measurement with a peak-to-peak amplitude of 2 με and (d) its FFT analysis.

    Figure 7.(a) 2D intensity map of the idler traces with dynamic strain variations applied. (b) Demodulated dynamic strain variations profile in the 5–6 m section. (c) Dynamic strain variations measurement with a peak-to-peak amplitude of 2 με and (d) its FFT analysis.

    D. High Spatial Resolution Analysis

    In conventional Brillouin scattering-based sensing techniques, the spatial resolution is typically limited by the phonon lifetime, which is approximately 10 ns, resulting in a spatial resolution of around 1 m. However, in the proposed technique presented here, the spatial resolution is significantly improved to 0.5 m by using a chirped pulse as the probe signal based on results above. This is achieved due to the absence of an SBS spectrum recovery process. Any technique used to recover the SBS spectrum carries the phonon lifetime information, which manifests as a spectral broadening and thus prevents the measurement of small spectral shifts. The chirped pulse allows for the measurement of the phase-matching condition of BEFWM instead of the SBS gain spectrum, resulting in an enhanced spatial resolution. In our proposed technique, the spatial resolution is determined by the birefringence variation and the frequency chirping rate. The effective pulse width, which accounts for these two parameters, ultimately determines the achievable spatial resolution. This is because the reflection probe signal in our proposed technique is dependent on the pump-probe frequency offset. In contrast to Rayleigh scattering, which exhibits responses for any incident frequency within the chirped pulse [23,24], the detection of BDG reflection requires phase-matching between four optical waves coupled by the acoustic wave. As a result, only certain frequency components within the chirped pulse satisfy this condition and are reflected by the BDG, so the phase-matching condition is satisfied at specific locations within the pulse width. For a given birefringence variation, the effective pulse width that covers these frequency components could be much smaller than the pulse width. The range of the frequency band within the chirped pulse that satisfies the phase-matching condition is determined by the frequency chirping rate.

    To investigate the impact of the frequency chirping rate on spatial resolution, we generated chirped pulses with varying chirping rates as the probe signals for the birefringence variation measurement. As shown in Fig. 8(a), all time-domain idler traces exhibit a time-varied profile, but with a different number of peaks and contrast. With the increased chirping rate, the same BDG gain bandwidth occupies a narrower time duration, giving a high spatial resolution. Thus, a faster time-varied profile with more peaks will be obtained. The peak number is counted within the 3 dB band for each trace, and the result is shown in Fig. 8(b). It is important to note that the BDG gain bandwidth is also length-dependent [25], meaning that a shorter interaction duration will result in a broader gain bandwidth. Hence, the chirping rate increases from 93.5 to 188 MHz/ns, giving a short occupation time duration with broadened BDG gain spectrum, and resulting in the same number of peaks. Besides, a shorter interaction time duration may also lower the contrast of the idler traces, as the probe signal’s optical power within the effective pulse width decreases with an increasing chirping rate. This relationship between the chirping rate and contrast is shown by the brown line in Fig. 8(b). Even if the detection end has enough SNR and contrast, the idler signal is finally getting flat, since the interaction section will be very small and the local phase-matching conditions are always satisfied. Finally, the spatial resolution was verified using the relatively optimized chirping rate of 93.5 MHz/ns, in which the fast varied intensity profile allows a short time window (1  ns) for time delay calculation and it has an acceptable contrast. In the experimental results, a spatial resolution of 10 cm (rising and falling edges) is achieved, as shown in Fig. 8(c). The spatial sample rate here is limited by the time window length. To further improve the spatial sampling rate (reduce the time window), an advanced data processing method can be developed to improve the measurement accuracy. This 10 cm spatial resolution with a 20 ns probe pulse width indicates that the phase-matching condition associated with BEFWM occurs at a much faster speed than the phonon lifetime-imposed limitation on spatial resolution, which is the reason why a higher spatial resolution than pulse width is achieved in our proposed system. The choice of the chirping rate is contingent upon the specific requirements of the practical application. A higher chirping rate yields greater spatial resolution, albeit at the expense of overall accuracy.

    (a) BDG reflection signal with different chirping rates. (b) Relationship between the number of peaks/signal contrast and the chirping rate. (c) Static strain distribution along with the fiber.

    Figure 8.(a) BDG reflection signal with different chirping rates. (b) Relationship between the number of peaks/signal contrast and the chirping rate. (c) Static strain distribution along with the fiber.

    4. CONCLUSION

    The paper presents what we believe, to the best of our knowledge, is a novel sensing system based on BEFWM with chirped pulse interrogation. The technique is able to measure distributed birefringence variations along PMFs, which were shown to be proportional to local time delays in the signal reflected by BDGs. As the birefringence is affected by temperature/strain, the technique allows for distributed temperature and strain sensing. The paper starts with an experimental characterization, where the frequency offset between the probe and pump signals is varied, showing a linear relationship due to the use of linearly chirped pulses. This validates the effectiveness of the proposed sensing system in measuring birefringence variations. Next, the distributed temperature and dynamic strain measurements are demonstrated on a section of PMF. The results show good linearity of temperature/strain-related time delay coefficients, indicating the capability of the proposed system for accurate and reliable temperature and strain measurements. Dynamic strain measurement is further validated by applying a sinusoidal variation profile with a frequency of 1 Hz, and the reconstructed peak-to-peak amplitude of 2 με from 1 kHz sampling rate shows the system’s ability to capture small dynamic strain variations. The spatial resolution of the system is analyzed by using different chirping rate pulses, and it is shown that a high spatial resolution of 10 cm is achieved using a frequency chirping rate of 93.5 MHz/ns, indicating the system’s capability for high-resolution measurements. Overall, the paper demonstrates the feasibility of using the proposed distributed phase-matching measurement with a fast sampling rate, high accuracy, and high spatial resolution.

    Acknowledgment

    Acknowledgment. The authors would like to thank Chen Chen, Haiyang Wang, Haokun Yang, and Gerard Tatel for their helpful discussions.

    APPENDIX A: THEORETICAL ANALYSIS OF BIREFRINGENCE VARIATIONS TO TIME DELAY MAPPING

    Birefringence, as a crucial property of polarization-maintaining fiber (PMF), is introduced by the difference in the thermal contraction between B2O3 doped silica and pure silica, as shown in Fig. 9. The two-dimensional stress is raised and stored in the core during the drawing process in fiber fabrication. The residual stress makes the refractive index of two axes different: x axis (nx) >y axis (ny). The birefringence value is defined by the refractive index difference between two axes (i.e., birefringence B=Δn=nxny). This value in the PMF is very small, about B=7.4×10⁴, but large enough to ensure less coupling between two orthogonal modes so that the linearly polarized lightwaves along either the x axis or the y axis could maintain their polarization states.

    Illustration of the birefringence property in the PMF.

    Figure 9.Illustration of the birefringence property in the PMF.

    The stimulated acoustic wave generated in the slow axis gives a spatially varied refractive index, which is common to both polarizations in the two axes. However, the birefringence converts this common spatial frequency to a different optical frequency for the two axes (νp and νpro). The SBS effect in the slow axis between the pump (νp) and Stokes wave (νS) will reach the maximum efficiency when the conservations of the energy and momentum are satisfied [12] by νB=νpνS,νBVa=nx(νp)·νpc+nx(νS)·νsc,where nx(νp) is the effective refractive index in the x axis at νp frequency and the phase-matching condition for the maximum reflectance from the BDG is obtained by the simultaneous conservation of the momentum for both the slow (x) axis and the fast (y) axis waves, which is described as νBVa=nx(νp)·νpc+nx(νpνB)·(νpνB)c=ny(νp+νBire)·(νp+νBire)c+ny(νp+νBireνB)·(νp+νBireνB)c,by applying the Taylor expansion to nx and ny around νp and simplification, we could obtain 2(nx(νp)ny(νp))·νp(ngxngy)·νB=2ngyνBire,where ngx and ngy are the group refractive index in the two axes, and νBire is the birefringence-induced frequency offset between the pump and the probe. Since νp is much larger than the Brillouin frequency, the term with νB could be ignored, leading to νBire=Δn·νpngy.

    The strain/temperature-induced frequency offset νBire changes can be directly measured by the local time delays by ΔνBire=Δνc·Δtz(ΔT,Δε)W.

    Thus, the relationship between the birefringence variations (ΔB) and the time delays (Δt) is given by ΔBz(ΔT,Δε)=Δνc·ngyW·νp·Δtz(ΔT,Δε),where ΔBz(ΔT,Δε) represents the strain/temperature-induced birefringence changes at location z.

    APPENDIX B: EXPERIMENTAL SETUP

    The experimental setup based on Brillouin dynamic gratings-assisted distributed birefringence variations measurement for temperature and strain sensing is shown in Fig. 10. The chirped pulse generation section is the same as that used in previous experiments, in which the distributed feedback (DFB) laser source is directly modulated by an electrical modulation (EM) signal that is generated by the pulse generator (PG). Before being amplified by the erbium-doped optical fiber amplifier (EDFA), the modulated signal from the DFB laser pulse-modulated served as the probe signal. Note that only the blue or red frequency shift section will be selected by carefully adjusting the time delays between the EM signals and the trigger signal so that the optical frequency is linearly varied within the pulse duration. After that, a polarization controller (PC), which is connected after an optical circulator, aligns the polarization to the fast axis before sending the probe pulses to the PMF under test through a polarization beam splitter (PBS).

    Experimental setup for distributed temperature and strain sensing based on BDG detection in the PMF. DFB laser: distributed feedback laser; SOA: semiconductor optical amplifier; EDFA: erbium-doped optical fiber amplifier; PC: polarization controller; PBS: polarization beam splitter; NLL: narrow linewidth laser; PG: pulse generator; OBPF: optical bandpass filter; PD: photodetector; and OSC: oscilloscope.

    Figure 10.Experimental setup for distributed temperature and strain sensing based on BDG detection in the PMF. DFB laser: distributed feedback laser; SOA: semiconductor optical amplifier; EDFA: erbium-doped optical fiber amplifier; PC: polarization controller; PBS: polarization beam splitter; NLL: narrow linewidth laser; PG: pulse generator; OBPF: optical bandpass filter; PD: photodetector; and OSC: oscilloscope.

    In another branch of the PBS, CW light from a narrow linewidth laser (NLL) source is divided into two beams aligned to the slow-axis polarization and then are sent to the two ends of PMF, acting as the pump signal and Stokes signal to excite the BDG. For the idler signal (probe signal reflection from the BDG) detection, an optical bandpass filter is used to filter out the other three waves in a fast-polarized backscattered signal, such that only the idler wave is detected at a photodetector (PD). Finally, the time domain could be collected by the oscilloscope (OSC), and the drive current of DFB laser is controlled by the computer to change the initial optical frequency for simulation purposes.

    APPENDIX C: SIMULATION RESULTS OF OFFSET FREQUENCY VARIATIONS TO TIME DELAY MAPPING

    As shown in Fig. 11(a), the idler traces within a 5 m window are collected when the νBire (frequency offset) is changed around 92.8 GHz with a range of 0–192 MHz by adjusting the frequency of the DFB laser. It clearly shows that the idler traces experience a longitudinal time shift from right to left with the increase in the frequency offset, as shown in Fig. 11(b), and the shifting direction depends on the sign of both νBire and the frequency chirping rate. To obtain the linear relationship between the time delays and the νBire changes, a time window of 5 ns is selected around the intensity peaks from two adjacent idler traces for cross-correlation calculation. The result is shown in Fig. 11(c), and the sensitivity of the frequency offset change-induced time delays is about 44.8 MHz/ns. In our experiments, the pulse width and frequency chirping range are set to 40 ns and 1.8 GHz, leading to a sensitivity of 45 MHz/ns, consistent with the simulation results. In addition, we also set another combination with a pulse width of 40 ns and a frequency chirping range of about 1.2 GHz, resulting in a chirping rate of 30.2 MHz/ns, as shown in Fig. 11(d).

    Simulation results of changing the pump-probe frequency offset (νBire) without temperature/strain variations applied. (a) 2D intensity map of the idler signal with frequency offset variations of 0–192 MHz. (b) Idler signal in a window of 1.5–3 m with different frequency offset variations. The relationship between frequency offset changes and time delays when different chirping rates are used: (c) 44.8 MHz/ns and (d) 30.2 MHz/ns.

    Figure 11.Simulation results of changing the pump-probe frequency offset (νBire) without temperature/strain variations applied. (a) 2D intensity map of the idler signal with frequency offset variations of 0–192 MHz. (b) Idler signal in a window of 1.5–3 m with different frequency offset variations. The relationship between frequency offset changes and time delays when different chirping rates are used: (c) 44.8 MHz/ns and (d) 30.2 MHz/ns.

    APPENDIX D: BIREFRINGENCE SENSITIVITIES TO TEMPERATURE/STRAIN

    In a high-birefringence fiber, such as a Panda-type PMF, the birefringence scale is determined by the residual tensile stress (σxy) with the ambient temperature (Ta) [26], calculated by Bσxy=k·(α3α2)·(TficTi),where Tfic denotes the fictive temperature (e.g., 850°C of silica glass), α3  (α2) is the thermal coefficient of stress-applying parts (pure silica cladding), and k is a constant determined by the geometrical location of stress-applying parts in the fiber. When the temperature increases (ΔT>0), the residual stress is released and the birefringence decreases. Thus, the temperature changes will introduce a birefringence change (ΔBT), given by ΔBT=B0·ΔTTfic25,where B0 is the birefringence value of the PMF at 25°C. Therefore, the birefringence sensitivity to temperature could be expressed by CBT=ΔBTΔT=B0Tfic25=8.97×10⁷/°C,where B0=7.4×10⁴. According to Eq. A6, the frequency offset sensitivities to temperature is about 118.6  MHz/°C when ngy=1.46 and νp is around 193 THz (λ=1550  nm).

    In contrast, when an axial strain variation Δε is applied to the fiber, additional stress is generated because the stress applying parts and the cladding contract in the lateral direction differently due to their different Poisson’s ratios (γ3>γ2). The strain variation induced birefringence change could be expressed by ΔBε=+B0·(γ3γ2)·Δε(α3α2)(Tfic25);thus, the birefringence sensitivity to strain is given by CBε=ΔBεΔε=+B0·γ3γ2(α3α2)(Tfic25)=8.99×10⁹/με,where γ3γ2(α3α2)(Tfic25)=12.2×10⁶/με. In addition, the frequency offset sensitivity to the strain is about 1.13 MHz/με when the νBire=92.8  GHz in our PMF.

    References

    [1] A. Scott. Efficient phase conjugation by Brillouin enhanced four wave mixing. Opt. Commun., 45, 127-132(1983).

    [2] A. Scott, M. Hazell. High-efficiency scattering in transient Brillouin-enhanced four-wave mixing. IEEE J. Quantum Electron., 22, 1248-1257(1986).

    [3] K. Y. Song, W. Zou, Z. He. All-optical dynamic grating generation based on Brillouin scattering in polarization-maintaining fiber. Opt. Lett., 33, 926-928(2008).

    [4] Y. Dong, X. Bao, L. Chen. Distributed temperature sensing based on birefringence effect on transient Brillouin grating in a polarization-maintaining photonic crystal fiber. Opt. Lett., 34, 2590-2592(2009).

    [5] V. Kalosha, W. Li, F. Wang. Frequency-shifted light storage via stimulated Brillouin scattering in optical fibers. Opt. Lett., 33, 2848-2850(2008).

    [6] D.-P. Zhou, Y. Dong, L. Chen. Four-wave mixing analysis of Brillouin dynamic grating in a polarization-maintaining fiber: theory and experiment. Opt. Express, 19, 20785-20798(2011).

    [7] K. Y. Song. Effects of induced birefringence on Brillouin dynamic gratings in single-mode optical fibers. Opt. Lett., 37, 2229-2231(2012).

    [8] K. Y. Song. Operation of Brillouin dynamic grating in single-mode optical fibers. Opt. Lett., 36, 4686-4688(2011).

    [9] Y. H. Kim, K. Y. Song. Mapping of intermodal beat length distribution in an elliptical-core two-mode fiber based on Brillouin dynamic grating. Opt. Express, 22, 17292-17302(2014).

    [10] S. Li, M.-J. Li, R. S. Vodhanel. All-optical Brillouin dynamic grating generation in few-mode optical fiber. Opt. Lett., 37, 4660-4662(2012).

    [11] W. Zou, J. Chen. All-optical generation of Brillouin dynamic grating based on multiple acoustic modes in a single-mode dispersion-shifted fiber. Opt. Express, 21, 14771-14779(2013).

    [12] K. Y. Song, K. Hotate, W. Zou. Applications of Brillouin dynamic grating to distributed fiber sensors. J. Lightwave Technol., 35, 3268-3280(2016).

    [13] Y. Dong, L. Chen, X. Bao. Truly distributed birefringence measurement of polarization-maintaining fibers based on transient Brillouin grating. Opt. Lett., 35, 193-195(2010).

    [14] P. Tovar, Y. Wang, L. Chen. Distributed birefringence sensing at 10−9 accuracy over ultra-long PMF by optical frequency comb and distributed Brillouin amplifier. Opt. Express, 30, 33156-33169(2022).

    [15] W. Zou, Z. He, K. Hotate. Demonstration of Brillouin distributed discrimination of strain and temperature using a polarization-maintaining optical fiber. IEEE Photonics Technol. Lett., 22, 526-528(2010).

    [16] K. Y. Song, S. Chin, N. Primerov. Time-domain distributed fiber sensor with 1 cm spatial resolution based on Brillouin dynamic grating. J. Lightwave Technol., 28, 2062-2067(2010).

    [17] S. Chin, N. Primerov, L. Thevenaz. Sub-centimeter spatial resolution in distributed fiber sensing based on dynamic Brillouin grating in optical fibers. IEEE Sens. J., 12, 189-194(2011).

    [18] A. Bergman, L. Yaron, T. Langer. Brillouin dynamic grating time-domain slope-assisted fast and distributed strain sensing. Proc. SPIE, 9157, 915770(2014).

    [19] A. Bergman, L. Yaron, T. Langer. Dynamic and distributed slope-assisted fiber strain sensing based on optical time-domain analysis of Brillouin dynamic gratings. J. Lightwave Technol., 33, 2611-2616(2015).

    [20] A. Bergman, T. Langer, M. Tur. Coding-enhanced ultrafast and distributed Brillouin dynamic gratings sensing using coherent detection. J. Lightwave Technol., 34, 5593-5600(2016).

    [21] Y. Dong, L. Chen, X. Bao. High-spatial-resolution time-domain simultaneous strain and temperature sensor using Brillouin scattering and birefringence in a polarization-maintaining fiber. IEEE Photonics Technol. Lett., 22, 1364-1366(2010).

    [22] Y. Okawa, R. K. Yamashita, M. Kishi. Distributed measurement of Brillouin dynamic grating spectrum localized by an intensity-modulated correlation-domain technique. Opt. Express, 28, 21310-21317(2020).

    [23] J. Pastor-Graells, H. F. Martins, A. Garcia-Ruiz. Single-shot distributed temperature and strain tracking using direct detection phase-sensitive OTDR with chirped pulses. Opt. Express, 24, 13121-13133(2016).

    [24] Y. Wang, P. Lu, S. Mihailov. Distributed time delay sensing in a random fiber grating array based on chirped pulse φ-OTDR. Opt. Lett., 45, 3423-3426(2020).

    [25] X. Xu, D.-P. Zhou, W. Peng. Spectral analysis of Brillouin dynamic gratings in polarization-maintaining fibers. Appl. Opt., 61, 2552-2557(2022).

    [26] W. Zou, Z. He, K. Hotate. Complete discrimination of strain and temperature using Brillouin frequency shift and birefringence in a polarization-maintaining fiber. Opt. Express, 17, 1248-1255(2009).

    Yuan Wang, Pedro Tovar, Juntong Yang, Liang Chen, Xiaoyi Bao. Distributed phase-matching measurement for dynamic strain and temperature sensing based on stimulated Brillouin scattering enhanced four-wave mixing[J]. Photonics Research, 2024, 12(1): 141
    Download Citation