• Laser & Optoelectronics Progress
  • Vol. 59, Issue 1, 0114003 (2022)
Meng Dou1, Yun Lu1、*, and Xuecai Wang2
Author Affiliations
  • 1Department of Materials Science and Engineer, Anhui University of Technology Maanshan, Anhui 243000, China
  • 2Careray Digital Medical Technology Co., Ltd., Suzhou , Jiangsu 215000, China
  • show less
    DOI: 10.3788/LOP202259.0114003 Cite this Article Set citation alerts
    Meng Dou, Yun Lu, Xuecai Wang. Forming Processes and Properties of Selective Laser Melted W-Re Alloy[J]. Laser & Optoelectronics Progress, 2022, 59(1): 0114003 Copy Citation Text show less
    W-Re alloy mixed powder. (a) Microstructure; (b) energy spectrum
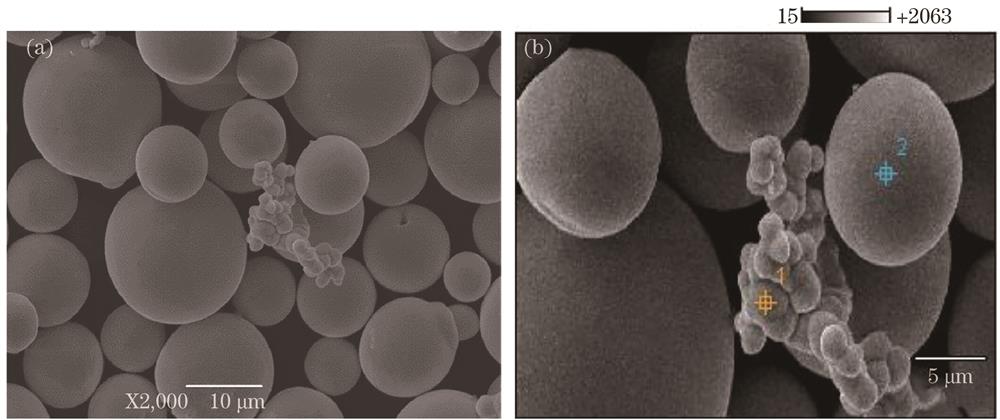
    Fig. 1. W-Re alloy mixed powder. (a) Microstructure; (b) energy spectrum
    Density of W-Re alloy parts with different laser powers and scanning speeds
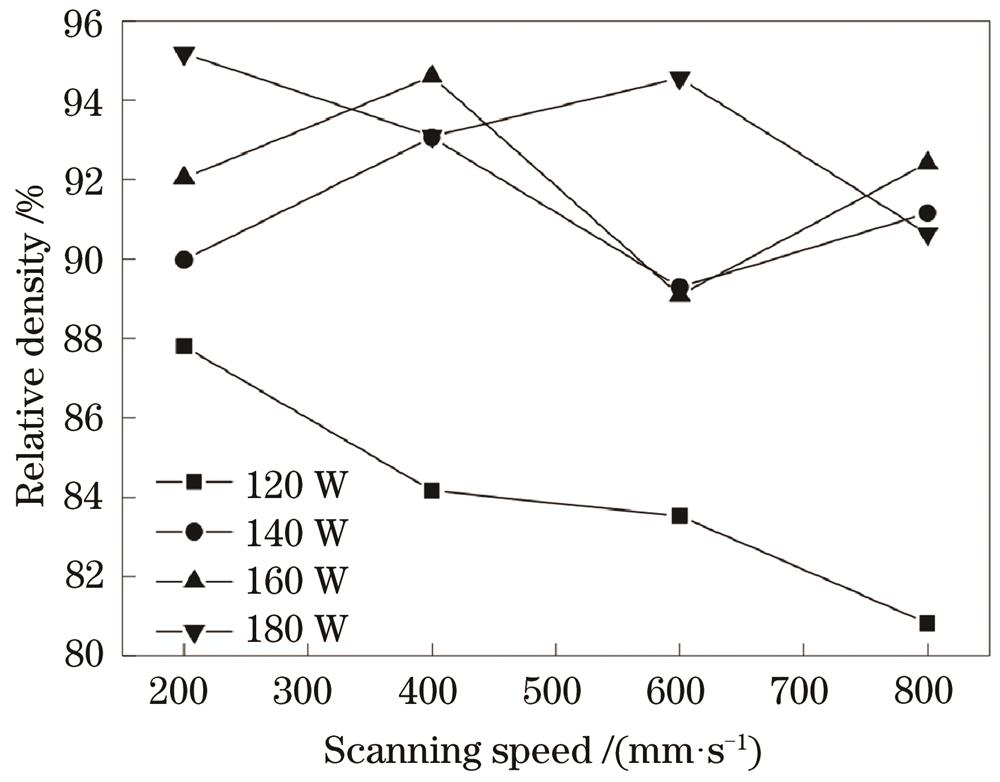
    Fig. 2. Density of W-Re alloy parts with different laser powers and scanning speeds
    Density of W-Re alloy with different scanning intervals
    Fig. 3. Density of W-Re alloy with different scanning intervals
    Comparison of densities of W-Re alloy and pure W samples with each parameter number under same process parameters
    Fig. 4. Comparison of densities of W-Re alloy and pure W samples with each parameter number under same process parameters
    Vickers hardness under different laser powers and scanning speeds
    Fig. 5. Vickers hardness under different laser powers and scanning speeds
    Metallographic photos of same scanning speed and different laser powers. (a) P=120 W; (b) P=160 W; (c) P=180 W
    Fig. 6. Metallographic photos of same scanning speed and different laser powers. (a) P=120 W; (b) P=160 W; (c) P=180 W
    Comparison of Vickers hardness of samples with different parameter numbers of pure W and W-Re alloy parts under same process parameters
    Fig. 7. Comparison of Vickers hardness of samples with different parameter numbers of pure W and W-Re alloy parts under same process parameters
    Experimental results. (a) XRD pattern of selective laser melting of W-Re alloy samples and pure W samples at different laser powers; (b) partial enlarged view; (c) XRD pattern of W-Re powder
    Fig. 8. Experimental results. (a) XRD pattern of selective laser melting of W-Re alloy samples and pure W samples at different laser powers; (b) partial enlarged view; (c) XRD pattern of W-Re powder
    Metallographic photos. (a) P=120 W, v=200 mm/s; (b) P=190 W, v=600 mm/s
    Fig. 9. Metallographic photos. (a) P=120 W, v=200 mm/s; (b) P=190 W, v=600 mm/s
    Metallographic photos of different laser powers. (a) P=120 W; (b) P=140 W
    Fig. 10. Metallographic photos of different laser powers. (a) P=120 W; (b) P=140 W
    Microcracks observed by SEM. (a) W-Re alloy P=180 W, v=400 mm/s; (b) pure W P=180 W, v=600 mm/s
    Fig. 11. Microcracks observed by SEM. (a) W-Re alloy P=180 W, v=400 mm/s; (b) pure W P=180 W, v=600 mm/s
    Mark pointWRe
    160.8639.14
    296.393.61
    Table 1. Mass distribution of marked points in mixed powder (mass fraction, %)
    Sample number12345678
    Laser power P /W180180180180190190190190
    Scanning speed v /(mm⋅s-1600600600600600600600600
    Scanning interval h /mm0.030.040.050.060.030.040.050.06
    Table 2. Corresponding relationship between sample number and process parameters
    Meng Dou, Yun Lu, Xuecai Wang. Forming Processes and Properties of Selective Laser Melted W-Re Alloy[J]. Laser & Optoelectronics Progress, 2022, 59(1): 0114003
    Download Citation