• Laser & Optoelectronics Progress
  • Vol. 59, Issue 12, 1217002 (2022)
Qing Yang1, Yuqian Zhao1、2、*, Fan Zhang1, and Miao Liao1
Author Affiliations
  • 1School of Automation, Central South University, Changsha 410083, Hunan , China
  • 2Hunan Engineering and Technology Research Center of High Strength Fastener Intelligent Manufacturing, Changde 415701, Hunan , China
  • show less
    DOI: 10.3788/LOP202259.1217002 Cite this Article Set citation alerts
    Qing Yang, Yuqian Zhao, Fan Zhang, Miao Liao. Liver Segmentation from CT Volumes Based on Spatial Fuzzy C-Means and Graph Cuts[J]. Laser & Optoelectronics Progress, 2022, 59(12): 1217002 Copy Citation Text show less
    Volumetric histogram of CT volume with DICOM data
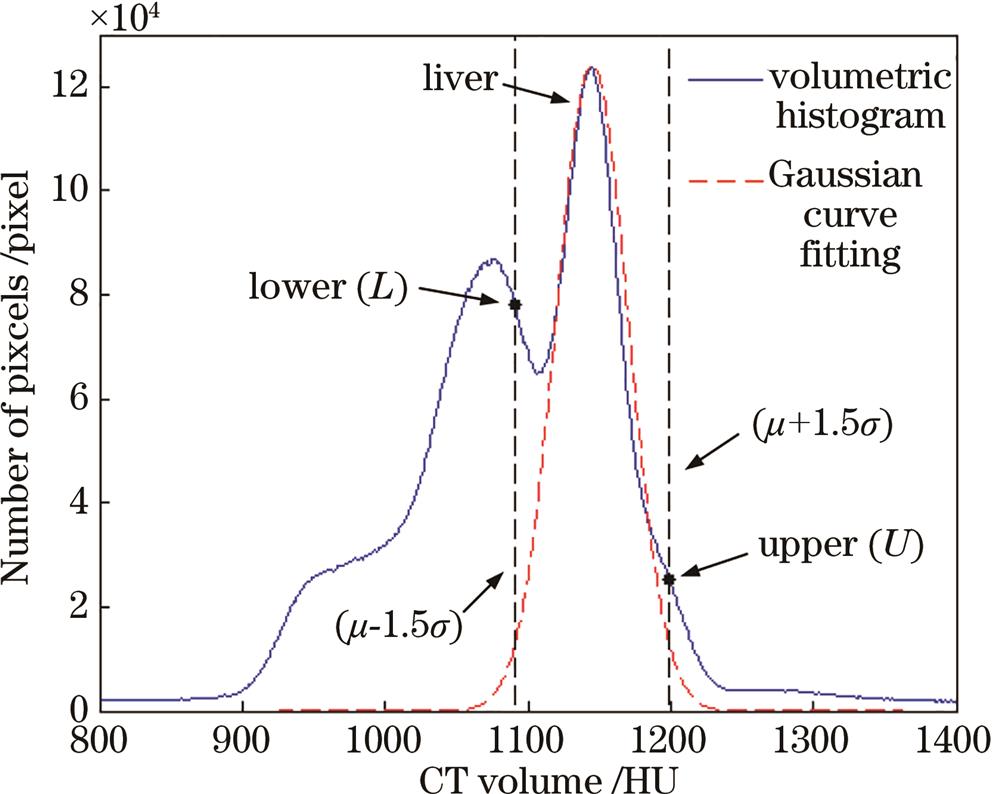
    Fig. 1. Volumetric histogram of CT volume with DICOM data
    Flowchart of proposed method
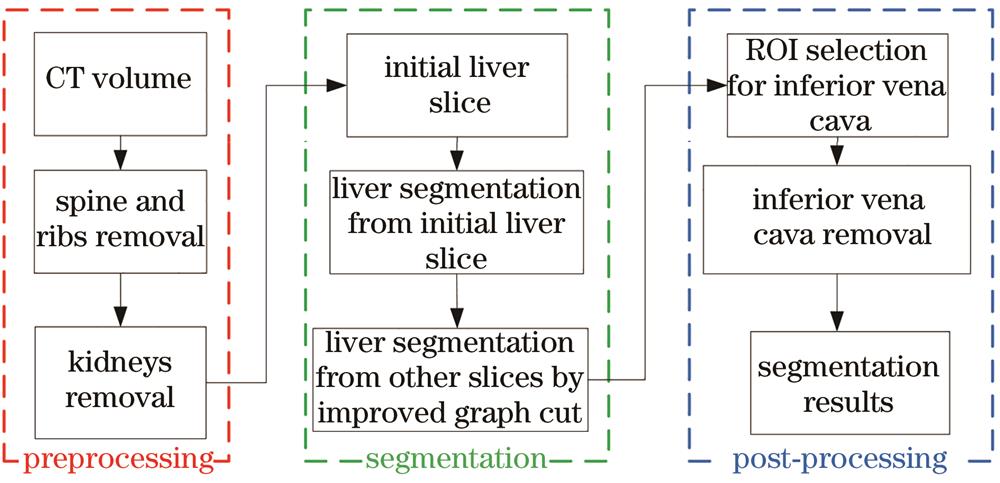
    Fig. 2. Flowchart of proposed method
    Removal of spine and ribs
    Fig. 3. Removal of spine and ribs
    Liver segmentation from initial slice
    Fig. 4. Liver segmentation from initial slice
    Segmentation result. (a) Without location information; (b) with location information
    Fig. 5. Segmentation result. (a) Without location information; (b) with location information
    Constrains estimation. (a) Result of previous segmentation; (b) image to be segmented; (c) image of distance transformation
    Fig. 6. Constrains estimation. (a) Result of previous segmentation; (b) image to be segmented; (c) image of distance transformation
    Comparison of segmentation results. (a) Without neighborhood pixels; (b) with neighborhood pixels
    Fig. 7. Comparison of segmentation results. (a) Without neighborhood pixels; (b) with neighborhood pixels
    Removal of inferior vena cava. (a) Result of segmentation; (b) result of erosion; (c) region of postcava; (d) result of postcava removal
    Fig. 8. Removal of inferior vena cava. (a) Result of segmentation; (b) result of erosion; (c) region of postcava; (d) result of postcava removal
    Result comparison of HLS, IRG, and proposed methods. (a) Results of HLS; (b) results of IRG; (c) results of proposed method
    Fig. 9. Result comparison of HLS, IRG, and proposed methods. (a) Results of HLS; (b) results of IRG; (c) results of proposed method
    Performance comparison of three methods over 20 CT volumes. Horizontal axis is number of CT volume and vertical axis are values of 5 evaluation methods, respectively. (a) VOE; (b) RVD; (c) ASD; (d) RMSD; (e) MSD
    Fig. 10. Performance comparison of three methods over 20 CT volumes. Horizontal axis is number of CT volume and vertical axis are values of 5 evaluation methods, respectively. (a) VOE; (b) RVD; (c) ASD; (d) RMSD; (e) MSD
    MethodVOE /%RVD /%ASD /mmRMSD /mmMSD /mm
    HLS11.1±2.4-6.3±3.12.3±0.85.2±1.940.2±9.4
    IRG8.1±2.0-3.0±2.91.3±0.52.9±1.245.5±21.9
    Proposed6.4±1.7-2.8±1.51.0±0.31.5±0.416.9±5.7
    Table 1. Performance comparison of three methods. Results of each method are mean and standard deviation of all test data
    Qing Yang, Yuqian Zhao, Fan Zhang, Miao Liao. Liver Segmentation from CT Volumes Based on Spatial Fuzzy C-Means and Graph Cuts[J]. Laser & Optoelectronics Progress, 2022, 59(12): 1217002
    Download Citation