• Matter and Radiation at Extremes
  • Vol. 4, Issue 2, 27401 (2019)
M. F. Yilmaz1、*, Y. Danisman2, M. Ozdemir1, B. Karl?k3, and J. Larour4
Author Affiliations
  • 1Basic Sciences, Engineering Department, Imam Abdulrahman Bin Faisal University, Dammam, Saudi Arabia
  • 2Department of Mathematics and Computer Sciences, Queensborough Community College, CUNY, Bayside, New York 11364, USA
  • 3Neurosurgical Simulation Research and Training Centre, Department of Neurosurgery, Montreal Neurological Institute and Hospital, McGill University, Montreal, Quebec H3A 2B4, Canada
  • 4Laboratoire de Physique des Plasmas (LPP), Ecole Polytechnique, UPMC, CNRS, Palaiseau, France
  • show less
    DOI: 10.1063/1.5081676 Cite this Article
    M. F. Yilmaz, Y. Danisman, M. Ozdemir, B. Karl?k, J. Larour. Investigation of electron beam effects on L-shell Mo plasma produced by a compact LC generator using pattern recognition[J]. Matter and Radiation at Extremes, 2019, 4(2): 27401 Copy Citation Text show less
    Top: Pinhole image. Bottom: Time integrated spectra of plasma of Mo XP_633.
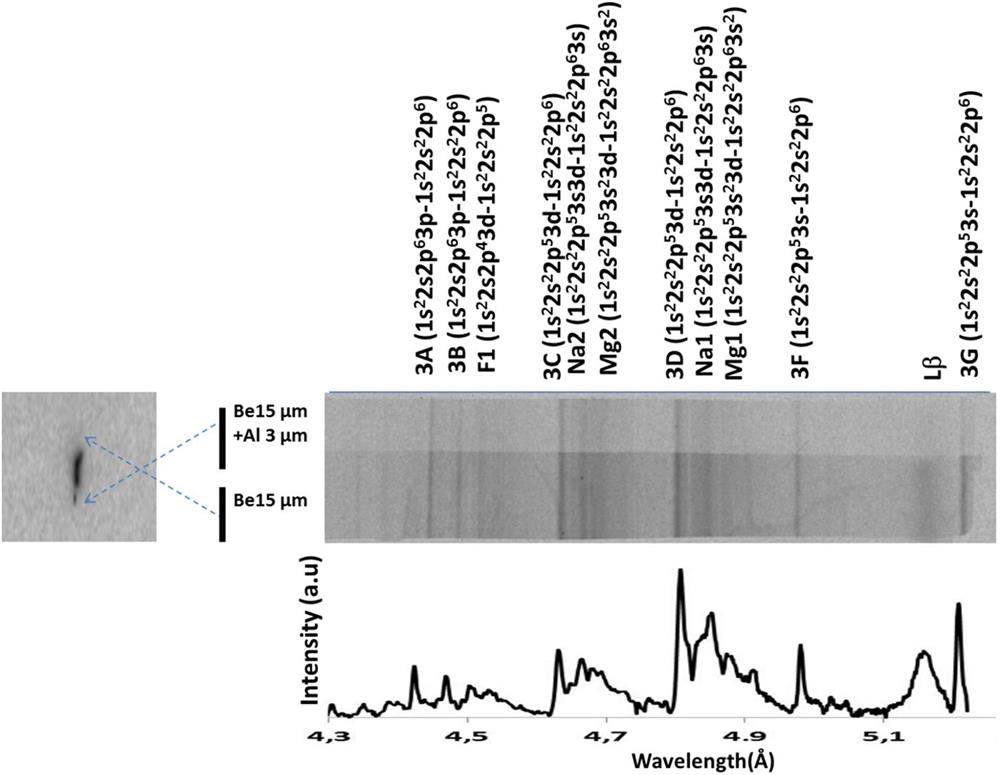
    Fig. 1. Top: Pinhole image. Bottom: Time integrated spectra of plasma of Mo XP_633.
    Close-up of the electrical and photonic records 400 ns around the time of pinching (shot XP_633). The electrical records (voltage, B-dot probe signal, current as numerically integrated from B-dot). X-ray signal is figured out by the XRD signal in volts (right scale).
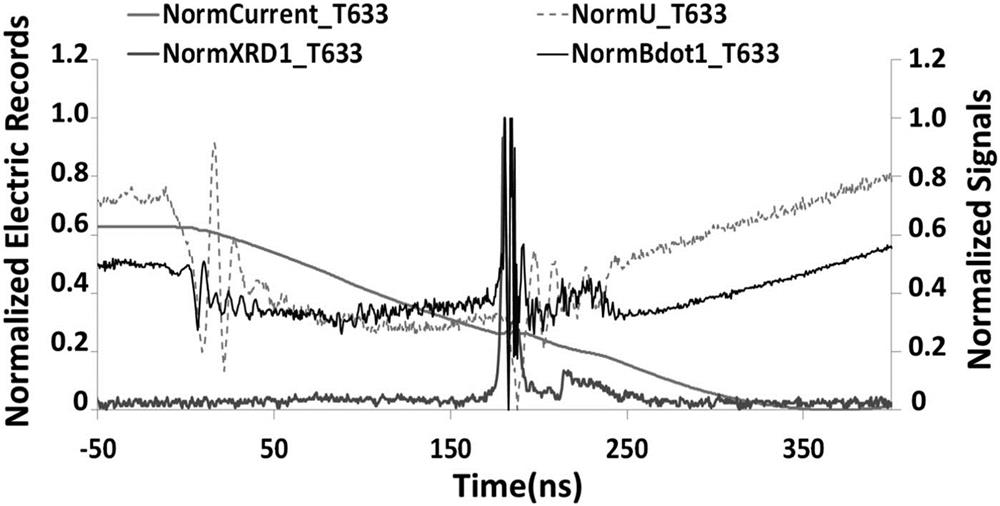
    Fig. 2. Close-up of the electrical and photonic records 400 ns around the time of pinching (shot XP_633). The electrical records (voltage, B-dot probe signal, current as numerically integrated from B-dot). X-ray signal is figured out by the XRD signal in volts (right scale).
    Dependence of the line ratios of (Na1+3D)/Mg1 on plasma electron temperatures for (a) ne = 1 × 1020 cm−3 and (b) ne = 1 × 1021 cm−3.
    Fig. 3. Dependence of the line ratios of (Na1+3D)/Mg1 on plasma electron temperatures for (a) ne = 1 × 1020 cm−3 and (b) ne = 1 × 1021 cm−3.
    Mean. |PC1〉 and |PC2〉 spectra without beam fraction, f = 0.0 and with beam fraction, f = 0.1.
    Fig. 4. Mean. |PC1〉 and |PC2〉 spectra without beam fraction, f = 0.0 and with beam fraction, f = 0.1.
    3D representation of |PC1〉, |PC2〉, and |PC3〉 coefficients for different electron beam fractions (a) f = 0.0, (b) 0.1, and (c) 0.2 at an electron density of ne = 1 × 1020 cm−3.
    Fig. 5. 3D representation of |PC1〉, |PC2〉, and |PC3〉 coefficients for different electron beam fractions (a) f = 0.0, (b) 0.1, and (c) 0.2 at an electron density of ne = 1 × 1020 cm−3.
    The correspondence of |PC1〉 coefficients and electron temperatures at classified electron densities of (a) ne = 1 × 1020 cm−3 and (b) ne = 1 × 1021 cm−3 and beam fractions.
    Fig. 6. The correspondence of |PC1〉 coefficients and electron temperatures at classified electron densities of (a) ne = 1 × 1020 cm−3 and (b) ne = 1 × 1021 cm−3 and beam fractions.
    Architecture of an FFNN for classification.
    Fig. 7. Architecture of an FFNN for classification.
    Comparison of the experimental spectrum of XP_633 (grey line) with (a) PCA-based ANN and (b) non-LTE modeling generated synthetic spectra (Te = 660 eV, ne = 1 × 1020 cm−3 and f = 0.1).
    Fig. 8. Comparison of the experimental spectrum of XP_633 (grey line) with (a) PCA-based ANN and (b) non-LTE modeling generated synthetic spectra (Te = 660 eV, ne = 1 × 1020 cm−3 and f = 0.1).
    M. F. Yilmaz, Y. Danisman, M. Ozdemir, B. Karl?k, J. Larour. Investigation of electron beam effects on L-shell Mo plasma produced by a compact LC generator using pattern recognition[J]. Matter and Radiation at Extremes, 2019, 4(2): 27401
    Download Citation