1Basic Sciences, Engineering Department, Imam Abdulrahman Bin Faisal University, Dammam, Saudi Arabia
2Department of Mathematics and Computer Sciences, Queensborough Community College, CUNY, Bayside, New York 11364, USA
3Neurosurgical Simulation Research and Training Centre, Department of Neurosurgery, Montreal Neurological Institute and Hospital, McGill University, Montreal, Quebec H3A 2B4, Canada
4Laboratoire de Physique des Plasmas (LPP), Ecole Polytechnique, UPMC, CNRS, Palaiseau, France
M. F. Yilmaz, Y. Danisman, M. Ozdemir, B. Karl?k, J. Larour. Investigation of electron beam effects on L-shell Mo plasma produced by a compact LC generator using pattern recognition[J]. Matter and Radiation at Extremes, 2019, 4(2): 27401
Copy Citation Text
In this paper, the effects of an electron beam on X-pinch-produced spectra of L-shell Mo plasma are investigated for the first time by principal component analysis (PCA); this analysis is compared with that of line ratio diagnostics. A spectral database for PCA extraction is arranged using a non-Local Thermodynamic Equilibrium (non-LTE) collisional radiative L-shell Mo model. PC vector spectra of L-shell Mo, including F, Ne, Na and Mg-like transitions are studied to investigate the polarization types of these transitions. PC1 vector spectra of F, Ne, Na and Mg-like transitions result in linear polarization of Stokes Q profiles. Besides, PC2 vector spectra show linear polarization of Stokes U profiles of 2p53s of Ne-like transitions which are known as responsive to a magnetic field [Tr?bert, Beiersdorfer, and Crespo López-Urrutia, Nucl. Instrum Methods Phys. Res., Sect. B 408, 107–109 (2017)]. A 3D representation of PCA coefficients demonstrates that addition of an electron beam to the non-LTE model generates quantized, collective clusters which are translations of each other that follow V-shaped cascade trajectories, except for the case f = 0.0. The extracted principal coefficients are used as a database for an Artificial Neural Network (ANN) to estimate the plasma electron temperature, density and beam fractions of the time-integrated, spatially resolved L-shell Mo X-pinch plasma spectrum. PCA-based ANNs provide an advantage in reducing the network topology, with a more efficient backpropagation supervised learning algorithm. The modeled plasma electron temperature is about Te ~ 660 eV and density ne = 1 × 1020 cm?3, in the presence of the fraction of the beams with f ~ 0.1 and centered energy of 5 keV.
I. INTRODUCTION
X-pinch discharge experiments at laboratory or table top scales generate localized, high-energy density plasmas, or so-called hot spots, with sizes 10−4 to 10−1 cm, temperatures 0.1 to 1 keV and electron densities ∼ 1018 to 1023 cm3. Suprathermal hot electrons with anisotropic velocity distributions are the typical by-product of X-pinch produced plasmas. Hot electrons are diagnosed by different experimental and computational methods, some of which are X-ray emission, electron bremsstrahlung and Kα emission, spectropolarimetry and particle-in-cell modelling.2–10 Polarization spectroscopy is known as one of the main methods to diagnose the state of anisotropy. Besides, a collisional radiative model with a non-Maxwellian electron distribution is another method to diagnose hot electrons in emission spectra.11 On the other hand, Yilmaz et al. showed that the application of principal component analysis (PCA) on the collisional radiative model of resonant transitions of L-shell Cu spectra results in linear Stokes profiles of polarization of Ne-like copper spectra. Stokes polarizations set parameters that can describe the degree and the shape of the polarization completely, and they are found in many applications of astrophysical spectra.12,13
PCA is one of the pattern recognition techniques that is used for reducing the dimension of a dataset of high dimension, while keeping a great amount of its variability. So, it makes it easier to visualize a dataset. It has been used in many fields like robotics, medicine, remote sensing and so on. PCA has also many applications in spectroscopy, especially in unmixing species and decomposing overlapped spectral lines of UV-VIS-NIR spectroscopy, which is critical for spectral fingerprinting.12,13 An artificial neural network (ANN), in simple terms, is a well-known machine learning algorithm that uses examples to extract rules. An ANN is composed of highly interconnected layers that process given examples. In our study, PCA coefficients (obtained as a result of PCA analysis and corresponding plasma electron temperature, density and beam fractions from a representative, time-integrated and spatially resolved L-shell Mo X-pinch plasma spectrum) are used as training examples of ANN.14
In this work, the effects of the electron beam on the non-LTE, collisional radiative model of L-shell Mo spectra, obtained by PCA, have been investigated for a typical X-pinch spectrum (shot XP_633), recorded on a compact low-energy device. The plasma electron temperature, density and beam fraction were extracted using a PCA-based ANN. The paper is organized as follows: Section II summarizes the experiments, and Sec. III studies the effect of the electron beams on the non-LTE K-shell spectra by means of line ratio diagnostics and PCA. Section IV presents the modeling of the experimental data by PCA-based ANN, and the conclusions are given in Sec. V.
II. EXPERIMENTS
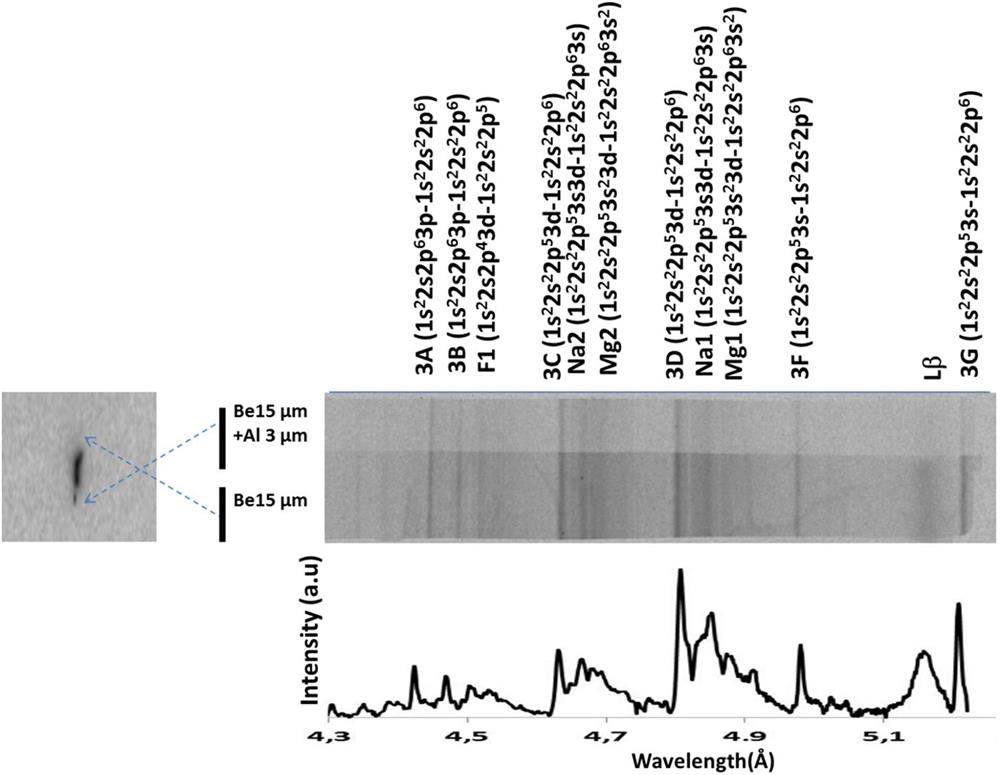
One can find the details of the X-pinch experiments of Mo shots in the work of Aranchuk and Larour. Briefly, the X-ray spectrum of Mo (shot XP_633) was generated by a discharge current of 250 kA with a rise time of 200 ns and a voltage of 40 kV. 25 μm of Mo wires were placed in the anode-cathode gap of 9 mm, in the form of an X shape to generate point-like plasma in the vicinity of the cross point of the wires. Spectra in the region of 4.3 Å – 5.2 Å were recorded through two X-ray spectrometers.15,16
A wider spectral region was registered by a convex mica crystal with a curvature of radius, 2d = 1.984 Å. The distance from the plasma was kept at 220 mm to achieve an effective dispersion of 25 eV/mm at the first order around 1 keV on a cylindrically bent film (R = 28 mm). A narrower spectral region was registered by a flat crystal spectrograph. Specifically, KAP (2d = 2.664 Å) and PET (2d = 0.874 Å) were used for the Mo experiments. The distance of the crystal from the plasma was 380 mm and the crystal-film one was 40 mm. The spectrometer was set up to record plasma emission of single shot, with λ/Δλ = 5000 and Δμm = 40 mm spectral and spatial resolutions, correspondingly.15 The time-integrated spectra were recorded on Kodak Direct Exposure film (DEF). The filtered pinholes (R = 30 μm) on the entrance window of the spectrometer were used to obtain the plasma sizes. The positions of the lines were estimated using the geometry for each shot. Then, a consistent set of lines was compared for identification with the database of spectra, measured in pulsed, hot plasma experiments with X-pinches and Z-pinches.15,16
A typical, axially resolved, X-ray spectrum of Mo (shot XP_633) and its corresponding pinhole image is given in Fig. 1. The F-like F1, Ne-like 3C, 3D, 3F and 3G, and the Na-like Na1 and Na2 transitions are well resolved in the spectrum. The observed Lβ transition is expected due to suprathermal electron beam effects in plasma.15,16 In Fig. 2, electrical (voltage, B-dot probe signal, current as numerically integrated from B-dot) and X-ray diode (XRD) records have been illustrated. Figure 2 shows that the main X-ray burst occurs around 180 ns, and that the magnetic field varies significantly after the main burst.
Figure 1.Top: Pinhole image. Bottom: Time integrated spectra of plasma of Mo XP_633.
Figure 2.Close-up of the electrical and photonic records 400 ns around the time of pinching (shot XP_633). The electrical records (voltage, B-dot probe signal, current as numerically integrated from B-dot). X-ray signal is figured out by the XRD signal in volts (right scale).
The database for modeling the plasma electron density and temperature of Mo (shot XP_633) was generated by using a previously developed L-shell, non-LTE collisional radiative model. The energy level structures, spontaneous and collisional rates, collisional and photoionization cross-section calculations were performed using the HULLAC code.17 The L-shell Mo model includes detailed structures for O-like to Mg-like Mo ions.16 The model uses a hybrid electron distribution function, F(e) = (1 − f)∗Fmaxwellian + f∗Fnonmaxwellian, to calculate the rates of collisional processes by integrating cross sections over the electron distribution function. In this work, the fraction, f, of hot electrons was described by a Gaussian distribution, centered at the characteristic energy E0 = 5 keV.12,13 Voigt profiles with a resolution d = 500 were used to fit line broadening of the experimental spectra.16
B. PCA analysis of L-shell Mo synthetic database
It has been already shown that the ratios Mg1/Na1, F1/Mg1 can be used as electron temperature diagnostics of L-shell Mo plasmas and vice versa.18,19 In this work, we used the line ratio (Na1+3D)/Mg1 as the plasma electron temperature diagnostic at moderate electron densities. Figure 3 shows that addition of the beam fraction fixes this ratio, especially when electron temperatures (Te) are less than 400 eV, and the plots tend to have a hollow form as the beam fraction increases.
Figure 3.Dependence of the line ratios of (Na1+3D)/Mg1 on plasma electron temperatures for (a) ne = 1 × 1020 cm−3 and (b) ne = 1 × 1021 cm−3.
Yilmaz et al.13 described that PCA also can be used as an alternative to line ratio diagnostics for investigating the effects of electron beams on each line dependence and for estimating plasma parameters.12,13 PCA is a dimension-reduction technique for large databases while retaining most of the information. The main goal of PCA is to diagnose the hidden structures of the database by linearly transforming the original variables into new, uncorrelated variables called principal components (PC). Principal components with the greatest eigenvalues correspond to the maximum variance. Principal components are the eigenvectors of the covariance matrix of the data associated with the largest eigenvalues.20,21
Principal Components (|PC1〉, |PC2〉, |PC3〉, etc.) are used to form an orthonormal basis of the new vector space with a smaller dimension. Each original data point is projected onto this space, and new coordinates are obtained by taking the dot product of the original data and each principal component.
For i = 1, 2, …, M, let Γi be the vectors in a data set of size N × 1. The mean of Γi’s isNow subtract the mean μ from each of Γi and defineμThe covariance matrix C iswhere superscript t means transpose and A = [ Φ1, Φ2, …, ΦM]. C is an N × N symmetric matrix. It is diagnosable and has N nonnegative eigenvalues and eigenvectors. The eigenvector corresponding to the largest eigenvalue is called the first principal component (|PC1〉), and the second and third largest ones are called the second (|PC2〉) and the third (|PC3〉) principal components, respectively. If a vector (|v〉) is projected into the space spanned by |PC1〉, |PC2〉 and |PC3〉 then we haveThe coefficients w1, w2 and w3 are called the weights of |PC1〉, |PC2〉 and |PC3〉 in |v〉 and calculated aswhere · is the dot product in Euclidean space (RN). Since |PC1〉, |PC2〉 and |PC3〉 are the most dominant three eigenvectors, the vector v(w1|PC1〉+w2|PC2〉+w2|PC2〉) has less significance, and it can be ignored. Therefore, it is enough to work on the three-dimensional space spanned by |PC1〉, |PC2〉 and |PC3〉. In this work, the PCA is applied to the data obtained for different electron beam fractions separately. Four densities are considered as a training set for a fraction. Each density consists of spectra for the temperatures 200, 220, 240,…, 900 eV (36 different temperatures).
One can measure the state of polarization of the light in terms of Stokes parameters. Stokes parameters of I, Q, U and V are used to describe the polarization type of the light. Stokes I represents unpolarized light, Q and U represent linearly polarized light, and V represents circularly polarized light.22 Since PCA can represent the database in a scalar and vectorial manner, one can easily observe the direction of the change of the spectral lines in a vectorial representation of the spectral database.12 Paletou showed that PCA is an efficient tool to extract Stokes parameters from polarized stellar data.23
Figure 4 illustrates the vector representations (|PC1〉 and |PC2〉) of L-shell Mo spectra. Mean spectra represent the unpolarized (Stokes I) spectra. |PC1〉 spectra show that addition of electron beams results in linear polarization of Stokes Q profiles for the considered transitions of F, Ne, Na and Mg-like L-shell Mo. |PC2〉 spectra, orthogonal to |PC1〉 spectra, show that the 3F and 3G of Ne-like Mo have direction changes from positive to negative, and Mg2-like Mo has a direction change from negative to positive, which is described as Stokes U. The 3F and 3G of Ne transitions have already been recognized as sensitive to magnetic fields.1 Our data in B-dot signals in Fig. 2 clearly show a significant variation of the induced magnetic fields after the main X-ray burst, and it is known that hot electron flux supports self-generated magnetic fields.24,25 For these reasons, |PC2〉 vector spectra are expected to represent propagation of the photons along the induced magnetic field.
Figure 4.Mean. |PC1〉 and |PC2〉 spectra without beam fraction, f = 0.0 and with beam fraction, f = 0.1.
Figure 5 shows the |PC1〉, |PC2〉, |PC3〉 coordinates of original data for different fractions at electron density ne = 1 × 1020 cm−3. In particular, each cluster corresponds to a fraction of electron beams. The clusters of the fractions (except for f = 0.0) are the translations of each other, and they form V-shaped cascade trajectories. This shows that the addition of electron beams stimulates collective behavior. Such V-shapes are observed in coronal bursts and are described by the two-stream instability due to the collective and hybrid nature of photon and plasmon interactions.12 Gedik et al. experimentally illustrated the periodic V-shape like Dirac cones which were due to the interaction between photons and free electrons (plasmons) of the Floquet-Bloch states of topological insulators. Furthermore, these free electrons selectively scattered between Floquet-Bloch and Volkov states.23,24
Figure 5.3D representation of |PC1〉, |PC2〉, and |PC3〉 coefficients for different electron beam fractions (a) f = 0.0, (b) 0.1, and (c) 0.2 at an electron density of ne = 1 × 1020 cm−3.
Figure 6 shows the electron temperature dependence of PC1 coefficients for the considered electron densities. As the fraction of the beam increases, the PC1 coefficients tend to have the shape of the curve for fractions f = 0.05 and f = 0.1. Such a tendency is in agreement with the line ratio diagnostics (Na1+3D)/Mg1. However, addition of the beam fraction linearizes the PC1 coefficients for f = 0.15 and f = 0.2.
Figure 6.The correspondence of |PC1〉 coefficients and electron temperatures at classified electron densities of (a) ne = 1 × 1020 cm−3 and (b) ne = 1 × 1021 cm−3 and beam fractions.
The ANN is a promising alternative method for classification, prediction and forecasting (nonlinear processing property).26 It is a powerful tool that can train given data to perform various tasks such as boundary and feature extraction, information retrieval and many other pattern recognition problems.27,28 The feed-forward neural networks (FFNNs) approach is a suitable structure for nonlinear separable input data. In the FFNN model, the neurons are organized in the form of layers. The neurons in a layer get input from the previous layer and feed their output to the next layer as shown in Fig. 7. In this type of network, connections between the neurons, in the same or previous layers, are not permitted. Learning processes in FFNNs occur through back-propagation, which requires providing pairs of input and target vectors.
Figure 7.Architecture of an FFNN for classification.
In this study, a three-layer feed-forward neural network with an error back-propagation algorithm was used for our purpose. We employed a PCA-based neural network to obtain the plasma parameters of the experimental spectra of X-Pinch, L-shell Mo spectra. In the back-propagation, a supervised learning algorithm with sigmoid transfer type function, as the activation function, was chosen in the back-propagation supervised learning algorithm. The activation function is used to transform the activation level of a unit (nodes or neuron) into an output signal.29 The gradient descent with a momentum weight and bias learning function is used in the back-propagation algorithm. The momentum constant was set to 0.95, while the learning rate was set to 0.01. The mean square error (MSE) was set to 1.5 × 10⁻⁵, while the number of epochs was selected as 2000.
The principal coefficients of the experimental spectra were computed by taking the dot product of principal components and the difference between this spectrum and the mean of the original 144 spectra. Then, the first principle component of experimental spectra, tested by the ANN to estimate the plasma electron temperature, and the PCA-based ANN gave Te = 659.89 eV–660 eV and ne = 1 × 1020 cm−3 and f = 0.1 of hot electrons. The experimental spectrum of XP_633 and its modeling by the PCA-based ANN and non-LTE modeling with the same parameters is illustrated in Figs. 8(a) and 8(b), respectively. It was found that the PCA-based ANN spectrum is better at estimating the Na1 and Na2-like lines. However, it overestimated the 3F and 3G lines when compared with the case of non-LTE modeling. The mean square errors between the experimental spectrum and the PCA-based ANN, and the experimental spectrum and the non-LTE modeling are 0.003 and 0.002, respectively.
Figure 8.Comparison of the experimental spectrum of XP_633 (grey line) with (a) PCA-based ANN and (b) non-LTE modeling generated synthetic spectra (Te = 660 eV, ne = 1 × 1020 cm−3 and f = 0.1).
PCA can be used for the data classification of a non-LTE collisional radiative L-shell Mo model, and each spectrum can be characterized by the dominant PC coefficients. The comparison of PCA with line ratio diagnostics shows that PCA can be used as an alternative plasma diagnostic of L-shell Mo spectra. The plot of |PC1〉, |PC2〉 and |PC3〉 coefficients (at electron density ne = 1 × 1020 cm−3) clearly shows that addition of an electron beam to the spectral model generates uniform clusters. F, Ne, Na and Mg-like L-shell Mo vector spectra tend to have linear polarization of Stokes Profiles in the presence of electron beams, which has also been observed with the Ne-like Cu L-shell spectra as described in our previous works.
[3] G. V. Ivanenkov, A. A. Kolomenskij, S. A. Pikuz, A. I. Samokhin, I. Ulshmid, S. M. Zakharov. Wire X-pinch in a high-current diode. Pis'ma Zh. Tekh. Fiz, 8, 1060-1063(1982).
[5] A. V. Agafonov, I. C. Blesener, D. A. Hammer, A. R. Mingaleev, S. A. Pikuz, V. M. Romanova, T. A. Shelkovenko. Hard x-rays and high-current electron beams from X-pinches, 1(2008).
[6] H. Chen, S. McLean, P. K. Patel, S. C. Wilks. Hot Electron Measurement and Modeling for Short-Pulse Laser Plasma Interactions(2003).
[18] M. F. Yilmaz. Radiative properties of L-shell Mo and K-shell Al plasmas from planar and cylindrical wire arrays imploded at 1 MA Z-pinch generator(2009).
[29] B. Karlik, A. V. Olgac. Performance analysis of various activation functions in generalized MLP architectures of neural networks. Int. J. Artif. Intell. Expert Syst. (IJAE), 1, 111-122(2011).
M. F. Yilmaz, Y. Danisman, M. Ozdemir, B. Karl?k, J. Larour. Investigation of electron beam effects on L-shell Mo plasma produced by a compact LC generator using pattern recognition[J]. Matter and Radiation at Extremes, 2019, 4(2): 27401