
Yan-fei LI, Dong HAN, Zong-jia QIU, Kang LI, Yi-kun ZHAO, Liu-jie WAN, Guo-qiang ZHANG. Characteristic Emission Spectrum Analysis and Discharge Identification on the Development Process of Air Corona Discharge[J]. Spectroscopy and Spectral Analysis, 2022, 42(9): 2956
- Spectroscopy and Spectral Analysis
- Vol. 42, Issue 9, 2956 (2022)
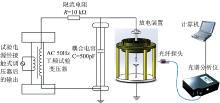
Fig. 1. Schematic diagram of the experimental platform
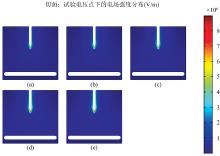
Fig. 2. Simulations of electric field intensity at five voltages
(a):U =12 kV; (b): U =13.5 kV; (c): U =14.8 kV;(d): U =16 kV; (e): U =16.9 kV
(a):
Fig. 3. Emission spectrum in the early stage of discharge
Fig. 4. Emission spectrum of the discharge with deeper degree (U =16 kV)
Fig. 5. Emission spectrum of the critical breakdown stage of discharge (U =16.9 kV)
Fig. 6. Spectral comparison of different discharge stages
Fig. 7. Normalized spectral intensities at three characteristic wavelengths
Fig. 8. Line chart of Full-band photons’ number varying with voltage
Fig. 9. Normalized photons’ number in three bands at different discharge stages
Fig. 10. Normalized photons’ number in two bands at different discharge stages

Set citation alerts for the article
Please enter your email address
© Copyright 2018-2021 | Chinese Laser Press. All Rights Reserved 沪ICP备15018463号-20