
Cheng-qian JIN, Zhen GUO, Jing ZHANG, Cheng-ye MA, Xiao-han TANG, Nan ZHAO, Xiang YIN. Non-Destructive Detection and Visualization of Soybean Moisture Content Using Hyperspectral Technique[J]. Spectroscopy and Spectral Analysis, 2022, 42(10): 3052
- Spectroscopy and Spectral Analysis
- Vol. 42, Issue 10, 3052 (2022)
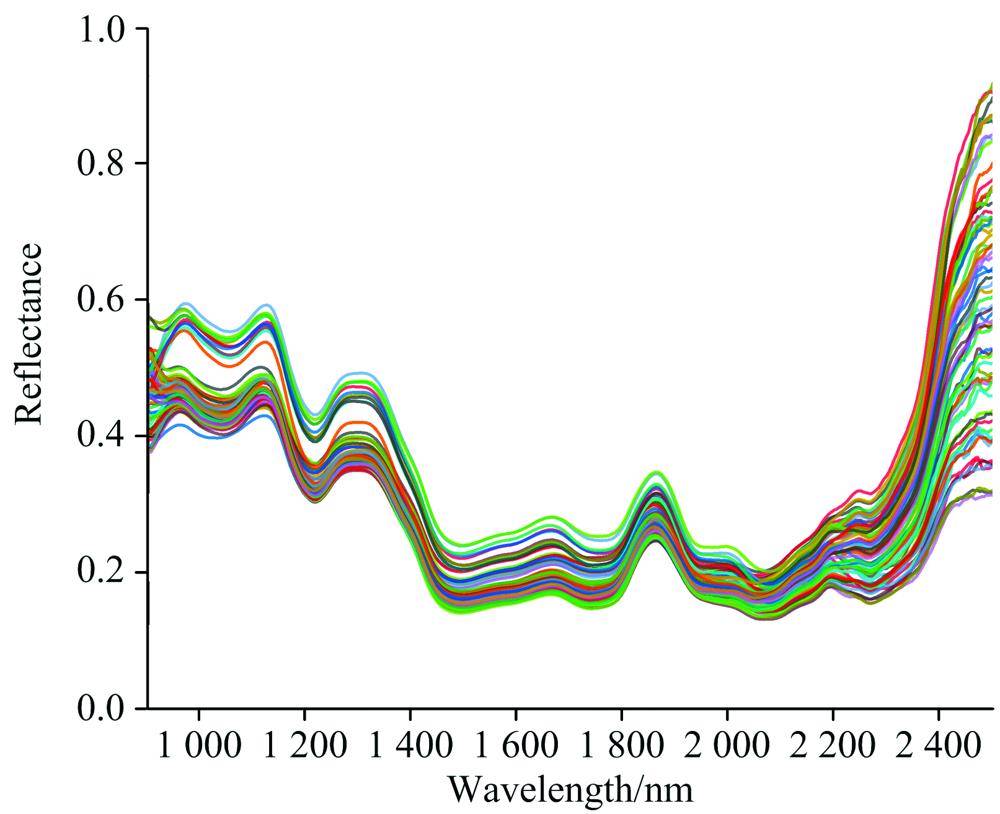
Fig. 1. Reflectance curves of spectrum
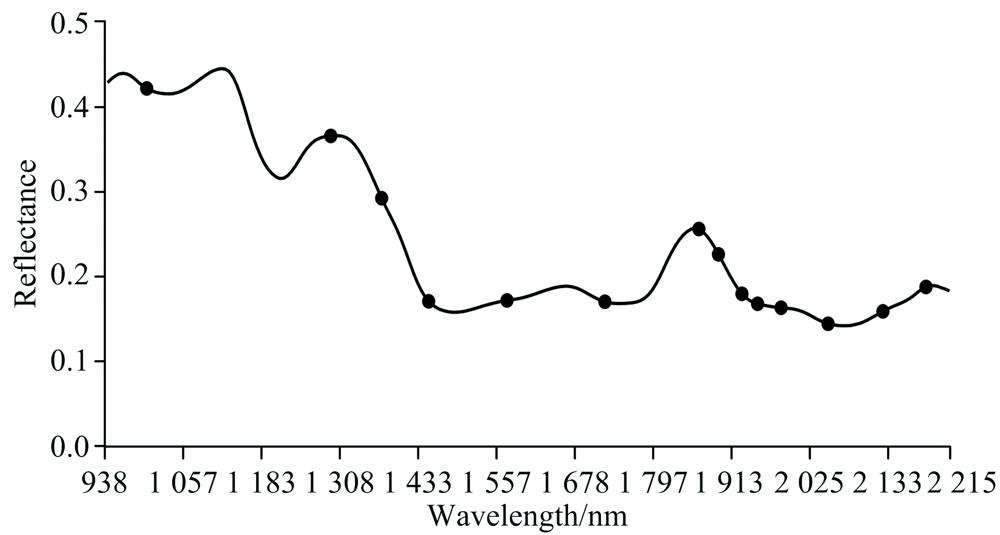
Fig. 2. Selected characteristic wavelengths by SPA
Fig. 3. Selection process of CARS variables
(a): Variation trend of the number of variables with the number of samples; (b): RMSECV; (c): The change process of regression coefficient of each variable with sampling times (The blue line represents the position with the lowest RMSECV)
(a): Variation trend of the number of variables with the number of samples; (b): RMSECV; (c): The change process of regression coefficient of each variable with sampling times (The blue line represents the position with the lowest RMSECV)
Fig. 4. Stability distribution curve of UVE-PLSR modle
Fig. 5. Visualization of soybean moisture content
(a): Huadou 2; (b): Kendou 40; (c): Wandou 701; (d): Wandou 34
(a): Huadou 2; (b): Kendou 40; (c): Wandou 701; (d): Wandou 34
| ||||||||||||||||||||||||||||
Table 1. Moisture content of soybean samples
| ||||||||||||||||||||||||||||||||||||||||||||||||||||||||||
Table 2. PLSR model based on different pretreatment methods
| |||||||||||||||||||||||||||||||||||||||||||||||||||||||||||||||||||||||||||||||||||||||||||||||||||||||||||||||||||||||||||||||||||||||||||||
Table 3. Performance of models based on different pretreatment methods and characteristic wavelengths selecting methods

Set citation alerts for the article
Please enter your email address
© Copyright 2018-2021 | Chinese Laser Press. All Rights Reserved 沪ICP备15018463号-20