• Chinese Optics Letters
  • Vol. 21, Issue 2, 021902 (2023)
Zhengnan Wu1、2, Yuangang Lu1、2、*, Jianqin Peng1、2, Jian Huang1、2, and Chongjun He1
Author Affiliations
  • 1Key Laboratory of Space Photoelectric Detection and Perception of Ministry of Industry and Information Technology, College of Astronautics, Nanjing University of Aeronautics and Astronautics, Nanjing 210016, China
  • 2College of Science, Nanjing University of Aeronautics and Astronautics, Nanjing 211106, China
  • show less
    DOI: 10.3788/COL202321.021902 Cite this Article Set citation alerts
    Zhengnan Wu, Yuangang Lu, Jianqin Peng, Jian Huang, Chongjun He. Nonlinear optical limiting effect of graphene dispersions at 3.8 µm[J]. Chinese Optics Letters, 2023, 21(2): 021902 Copy Citation Text show less
    Characterization images of experimental graphene. (a) TEM image of single-layer graphene; (b) HRTEM image of single-layer graphene; (c) XRD pattern of single-layer graphene; (d) XPS pattern of single-layer graphene.
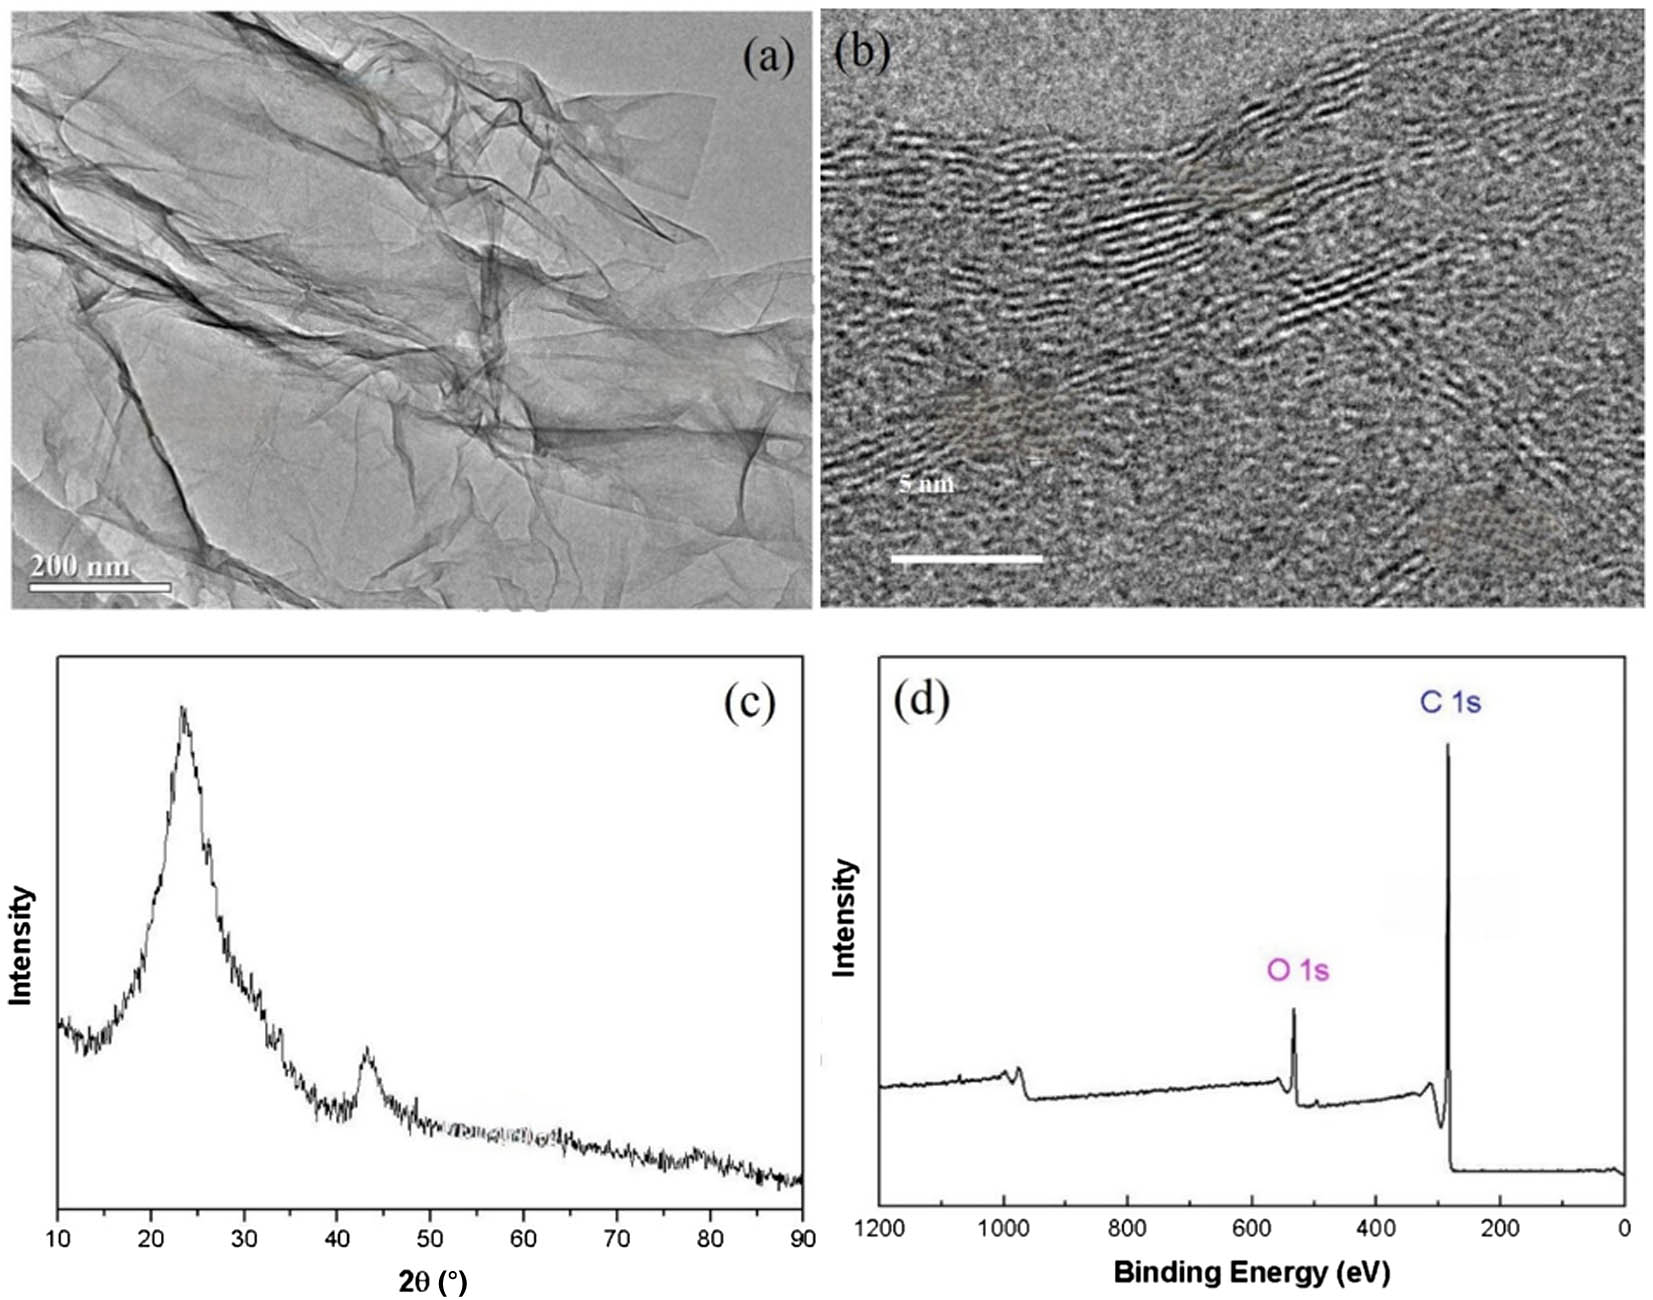
    Fig. 1. Characterization images of experimental graphene. (a) TEM image of single-layer graphene; (b) HRTEM image of single-layer graphene; (c) XRD pattern of single-layer graphene; (d) XPS pattern of single-layer graphene.
    Schematic diagram of the experimental setup.
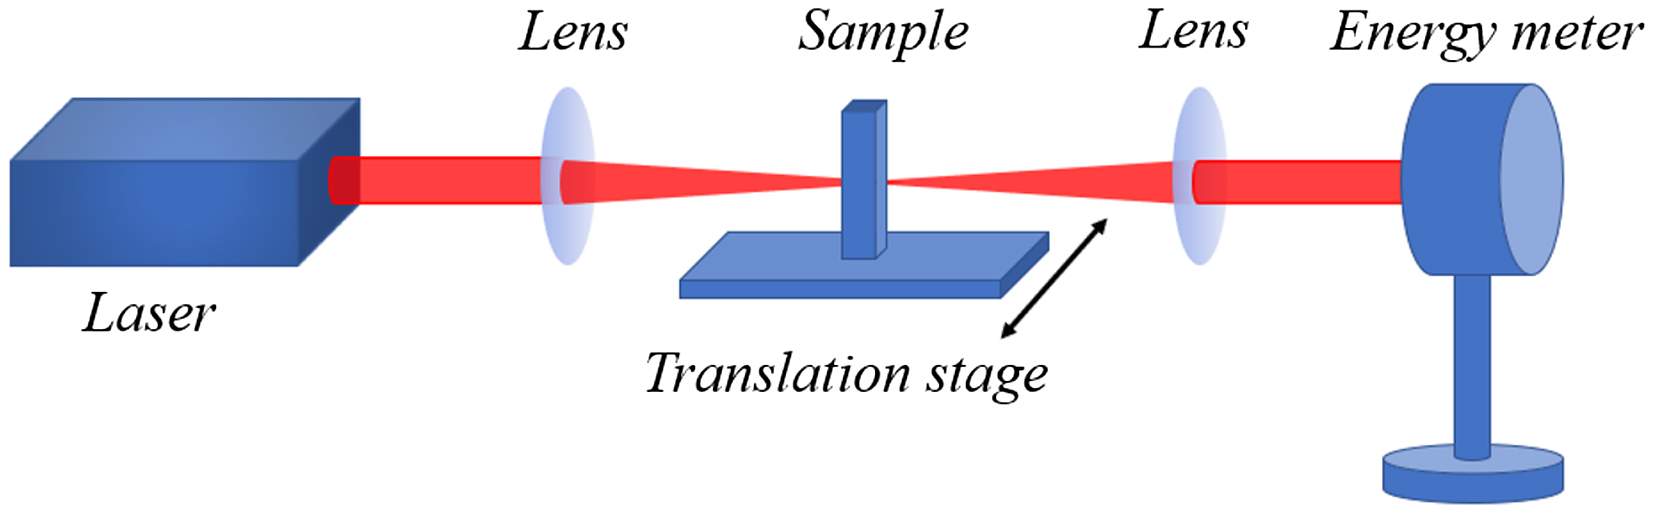
    Fig. 2. Schematic diagram of the experimental setup.
    Transmittances of graphene dispersions at two different concentrations with thickness of (a) 10 mm and (b) 20 mm.
    Fig. 3. Transmittances of graphene dispersions at two different concentrations with thickness of (a) 10 mm and (b) 20 mm.
    Transmittances of graphene dispersions at two different thicknesses with concentration of (a) 0.004 mg/mL and (b) 0.008 mg/mL.
    Fig. 4. Transmittances of graphene dispersions at two different thicknesses with concentration of (a) 0.004 mg/mL and (b) 0.008 mg/mL.
    Transmittance changes with incident fluence (solid dots) and bubble radius (solid line) under different sample thicknesses and concentrations. (a) 10 mm, 0.004 mg/mL; (b) 20 mm, 0.004 mg/mL; (c) 10 mm, 0.008 mg/mL; (d) 20 mm, 0.008 mg/mL.
    Fig. 5. Transmittance changes with incident fluence (solid dots) and bubble radius (solid line) under different sample thicknesses and concentrations. (a) 10 mm, 0.004 mg/mL; (b) 20 mm, 0.004 mg/mL; (c) 10 mm, 0.008 mg/mL; (d) 20 mm, 0.008 mg/mL.
    Scattering and absorption coefficients versus bubble radius.
    Fig. 6. Scattering and absorption coefficients versus bubble radius.
    NumberConcentration (mg/mL)SoluteSolvent (50 mL)
    10.004Graphene (0.2 mg)Carbon tetrachloride
    20.008Graphene (0.4 mg)Carbon tetrachloride
    Table 1. Parameters of Two Graphene Dispersions
    NumberConcentration (mg/mL)Thickness (mm)Linear TransmittanceMinimum TransmittanceδLimiting Threshold (J/cm2)
    10.0041075.2%36.5%0.3870.13
    20.0042068.7%29.6%0.3910.14
    30.0081069.7%29.2%0.4050.14
    40.0082062.1%26.4%0.3560.15
    Table 2. Experimental Results of Graphene Dispersion
    MaterialsδTminWavelengthReferences
    Graphene dispersions in carbon tetrachloride0.4050.2923.8 µmThis article
    0.5 m As2Se3 fiber0.8930.1233.6 µm[15]
    Graphene oxide dispersions in N-methylpyrrolidone0.3850.4231.75 µm[27]
    Graphene oxide Ormosil glasses0.3160.1841.57 µm[28]
    ZnGeP20.2860.5914.1 µm[29]
    Table 3. Comparison of Optical Limiting Properties of Several Materials
    Zhengnan Wu, Yuangang Lu, Jianqin Peng, Jian Huang, Chongjun He. Nonlinear optical limiting effect of graphene dispersions at 3.8 µm[J]. Chinese Optics Letters, 2023, 21(2): 021902
    Download Citation