
Zhengnan Wu, Yuangang Lu, Jianqin Peng, Jian Huang, Chongjun He. Nonlinear optical limiting effect of graphene dispersions at 3.8 µm[J]. Chinese Optics Letters, 2023, 21(2): 021902
- Chinese Optics Letters
- Vol. 21, Issue 2, 021902 (2023)
Abstract
1. Introduction
With the wide application of high-power, high-intensity, and short-pulse lasers in industrial and military fields, the related optical limiting and protection materials have also begun to flourish. In particular, optical limiting materials, including phase change materials, and linear and nonlinear optical limiting (NOL) materials[1], have been the focus of research for many years[2]. Among them, NOL materials have received extensive attention due to their excellent optical effects. Compared with other materials, NOL materials usually have the advantages of a high damage threshold and a short response time. More importantly, some NOL materials have a wide operating wavelength range, which makes them suitable for wideband optical limiting. Among the common NOL materials, semiconductors[3] and organic materials[4,5] have been widely studied for several decades. Some new NOL materials such as inorganic metal clusters[6,7], carbon nanotubes[8,9], and composite nanomaterials[10,11] have developed rapidly in recent years[12–14]. However, the previous reports on NOL materials have mainly focused on the visible and near-infrared region, while there are few reports about NOL within the mid-infrared region (especially at the wavelength of 3–5 µm). The NOL within the mid-infrared region is important, as it can be used to protect the human eye and some sensitive sensors from high-power mid-infrared lasers in many fields such as the military field, biomedicine, and material processing. We have recently achieved good optical limiting effect of 3–5 µm by using an fiber[15], but in general the fibers are difficult to apply to the large-area laser limiting due to their small core size.
In this study, we present a novel mid-infrared laser optical limiting suspension, graphene dispersion in carbon tetrachloride, at the wavelength of 3.8 µm. Unlike other optical limiting materials such as optical fibers and phase change films, graphene dispersion in carbon tetrachloride is not limited by material size and the preparation process and can be used for large-area mid-infrared laser limiting. The optical limiting effect of graphene dispersions in carbon tetrachloride is measured at the wavelength of 3.8 µm. In our experiments, graphene dispersions in carbon tetrachloride under two different concentrations (0.004 and 0.008 mg/mL) and two different thicknesses (10 and 20 mm) are used. These experimental results demonstrate that graphene dispersions in carbon tetrachloride may be a promising NOL material at 3.8 µm.
2. Experimental Setup
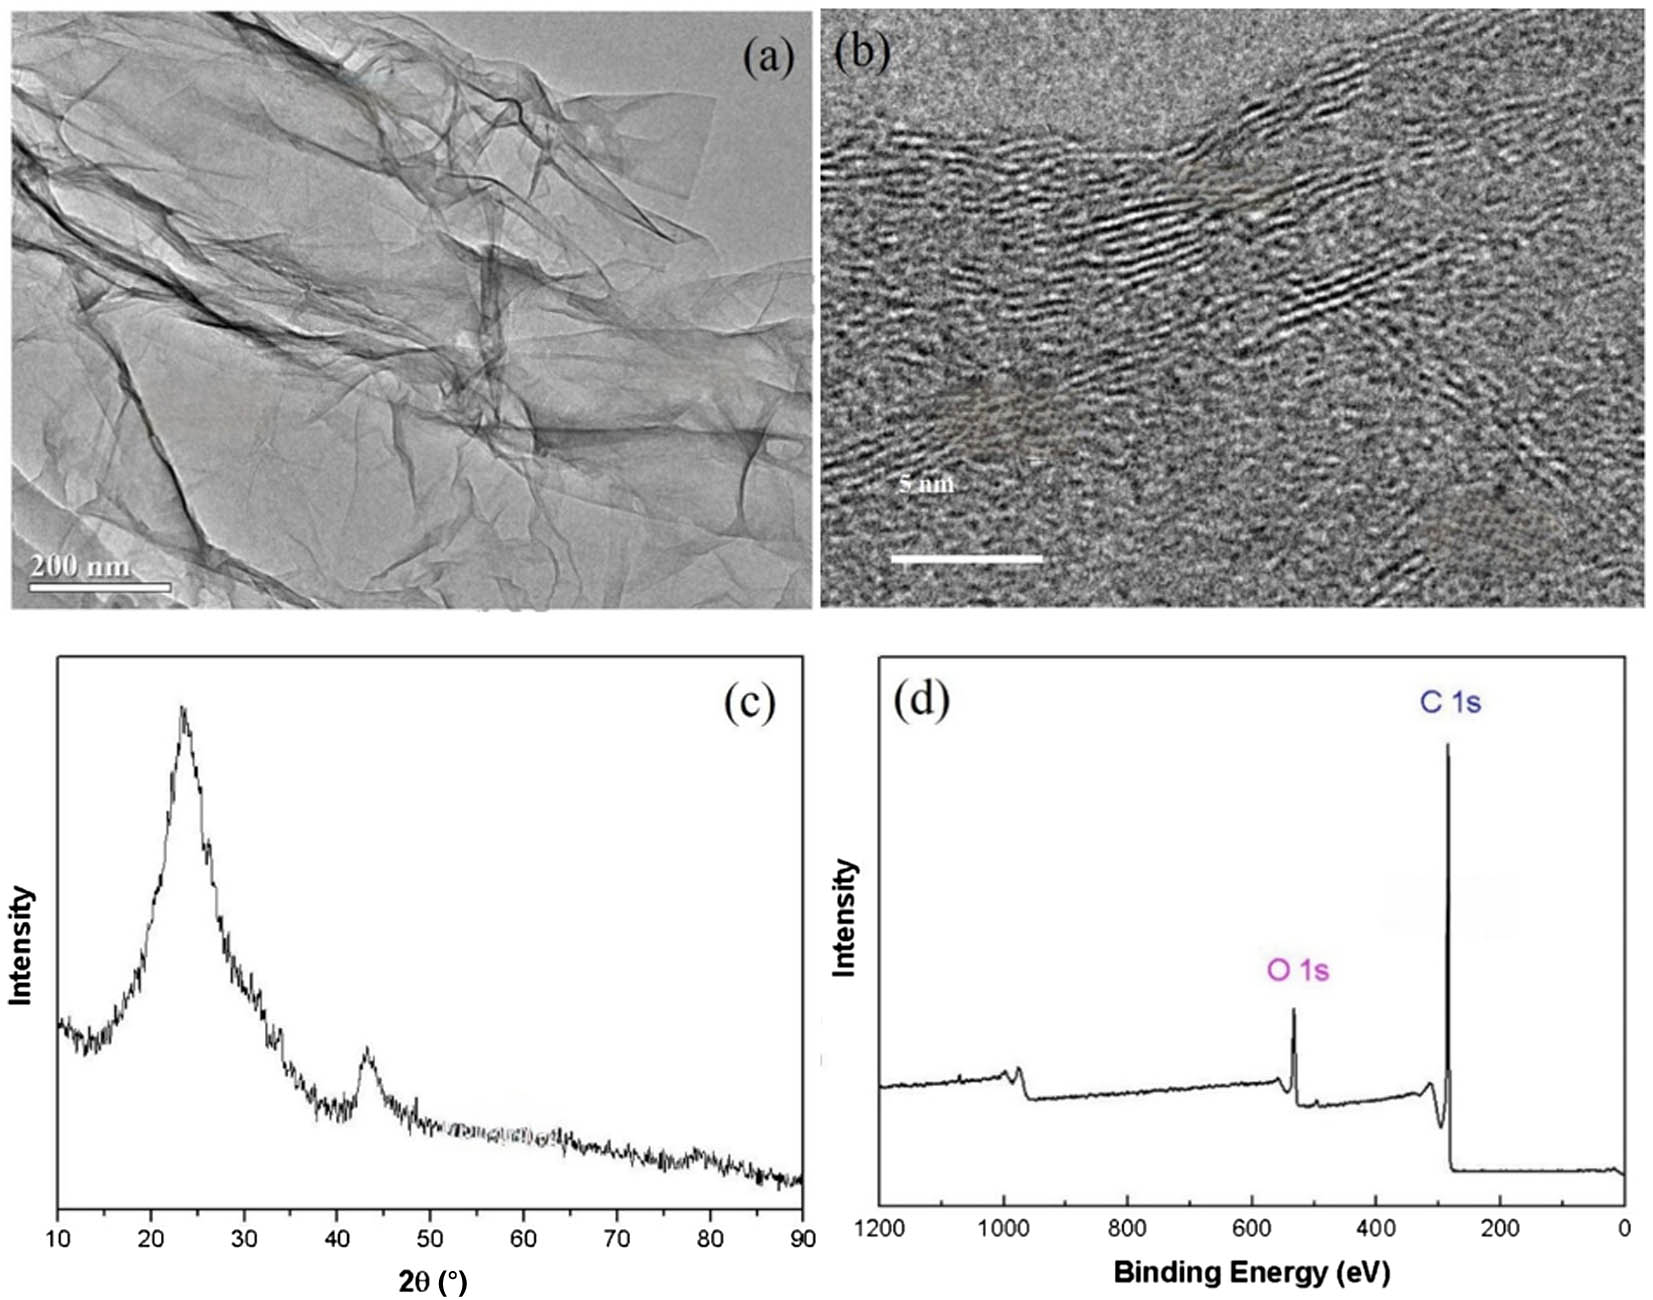
In the experiment, the graphene material is high-temperature-reduced graphene oxide; the characterization images of the graphene are shown in Fig. 1. The microscopic morphology of graphene nanosheets can be obtained by analyzing transmission electron microscope (TEM) and high-resolution transmission electron microscope (HRTEM) images, and the purity of graphene nanosheets can be obtained by analyzing X-ray diffraction (XRD) patterns and X-ray photoelectron spectroscopy (XPS) patterns. The thickness of graphene nanosheets is about 0.8 nm, the diameter is 0.5–5 µm, purity is about 99%, and the single-layer ratio is more than 80%. Graphene material and the above information are obtained from Nanjing XFNano Materials Tech Co., Ltd. (Nanjing, China). When preparing the dispersion, we first weighed 0.1 mg of graphene, then dissolved it in 10 mL of carbon tetrachloride liquid to make a dispersion with a concentration of 0.01 mg/mL. To ensure the uniformity of the dispersion, the resultant dispersions were sonicated at 40 kHz for 30 min. Then a certain amount of carbon tetrachloride was added to the dispersion of 0.01 mg/mL according to the experimental requirements to prepare a dispersion with the specific concentration. The diluted dispersion was sonicated at 40 kHz for 30 min again. The final experimental dispersion is very homogeneous and does not precipitate within 8 h.
Sign up for Chinese Optics Letters TOC. Get the latest issue of Chinese Optics Letters delivered right to you!Sign up now
![]()
Figure 1.Characterization images of experimental graphene. (a) TEM image of single-layer graphene; (b) HRTEM image of single-layer graphene; (c) XRD pattern of single-layer graphene; (d) XPS pattern of single-layer graphene.
![]()
Figure 2.Schematic diagram of the experimental setup.
According to the transmittance at the 3.8 µm wavelength, and considering the safety of the experiment, carbon tetrachloride was selected as the solvent, which has the advantages of high solubility and low toxicity. We prepared two kinds of graphene dispersions in carbon tetrachloride with different concentrations of 0.004 mg/mL and 0.008 mg/mL. The parameters of the prepared graphene dispersions are shown in Table 1.
| Number | Concentration (mg/mL) | Solute | Solvent (50 mL) |
|---|---|---|---|
| 1 | 0.004 | Graphene (0.2 mg) | Carbon tetrachloride |
| 2 | 0.008 | Graphene (0.4 mg) | Carbon tetrachloride |
Table 1. Parameters of Two Graphene Dispersions
The experimental setup used to evaluate the NOL performance of graphene dispersion is shown in Fig. 2. A solid-state pulsed laser with a wavelength of 3.8 µm was used as the light source in the transmittance measurement. The repetition frequency and pulse width of the laser were set as 1 Hz and 12 ns, respectively. The probe beam passed through a lens and then through the sample positioned in the focal plane of the lens. The laser beam passing through the sample cell was converged with another lens and recorded with an energy meter. The focal length of the lens was 80 mm, and the area of the laser spot on the sample was . The sample was placed on a translation table, which makes it possible to move perpendicularly to the light propagation direction. The incident and transmission energies of the sample were measured by the energy meter when the sample was removed from the optical path and irradiated by the laser, respectively. Therefore, the transmittance of the graphene dispersion sample can be obtained by comparing the ratio of the energy on the energy meter with and without the sample in the optical path. The time interval between these two measurements was about 20 s. Since the root mean square error (RMSE) output energy of the laser within 30 s is less than , the transmittance measurement uncertainty due to laser energy instability was . In each measurement, 20 data points were recorded and averaged to reduce measurement uncertainty. The transmittances of the graphene dispersion corresponding to different input fluence can be obtained by gradually increasing the laser output energy.
3. Experimental Results and Discussion
To accurately evaluate the NOL ability of graphene dispersions, we define the optical limiting capacity coefficient as[16]
The transmittances of graphene dispersions at two concentrations (0.004 and 0.008 mg/mL) are depicted in Fig. 3. When the incident laser energy density is low (less than ), the transmittances of the graphene dispersions are relatively high, which are almost larger than 0.6. When the input fluence increases gradually, the graphene dispersions gradually exhibit NOL characteristics, and the transmittance decreases with the increase of the incident energy density. In Fig. 3(a), when the thickness of graphene dispersion is 10 mm, for the graphene dispersions with the concentration of 0.004 and 0.008 mg/mL, the limiting thresholds are, respectively, 0.13 and , the minimum transmittances are, respectively, 0.365 and 0.292 when the input fluence is , and the are, respectively, 0.387 and 0.405. The results show that the graphene dispersion with higher concentration can achieve better NOL performance, though it has a lower linear transmittance. The situation in Fig. 3(b) is similar to that in Fig. 3(a). When the thickness of graphene dispersion is 20 mm, for the graphene dispersions with the concentration of 0.004 and 0.008 mg/mL, the limiting thresholds are, respectively, 0.14 and , the minimum transmittances are, respectively, 0.296 and 0.264 when the maximum input fluence is , and the are, respectively, 0.391 and 0.356. The optical limiting performance of graphene dispersions is positively correlated with concentration.
![]()
Figure 3.Transmittances of graphene dispersions at two different concentrations with thickness of (a) 10 mm and (b) 20 mm.
We also compare the influence of thickness on the optical limiting ability of graphene dispersions. In Fig. 4, we show the transmittance of graphene dispersions at the same concentration for two different thicknesses. As shown in Figs. 4(a) and 4(b), both the minimum transmittance and the linear transmittance decrease with the increase of sample thickness. It can be simply understood that as the sample thickness increases, the laser has more chance to touch graphene on the way forward. In Fig. 4(a), the slope of the transmittance curve with the thickness of 20 mm is smaller than that of the thickness of 10 mm when the input fluence is in the range from to , while the slope of the transmittance curve with the thickness of 20 mm is larger than that of the thickness of 10 mm when the input fluence is in the range from to . In Fig. 4(b), the slope of the transmittance curve with the thickness of 20 mm is smaller than that of the thickness of 10 mm when the input fluence is in the range from to . In this case, we speculate that the optical limiting mechanism of graphene–carbon tetrachloride dispersion may be Mie scattering. For Mie scattering, under the same other conditions, the more bubbles produced by laser or the larger the bubble radius, the faster the transmittance curve decreases with the increase of incident fluence[17]. When the other conditions are same, the thicker the dispersion, the more scattering sources in the dispersion, which will enhance the optical limiting capacity of the dispersion. However, the thicker dispersion will reduce the average energy density obtained by each scattering source and thus results in smaller radius of bubbles in the dispersion, which will weaken the optical limiting capacity of the dispersion. Therefore, there is no simple linear relationship between thickness and optical limiting capacity.
![]()
Figure 4.Transmittances of graphene dispersions at two different thicknesses with concentration of (a) 0.004 mg/mL and (b) 0.008 mg/mL.
In Table 2, we present the experimental results of graphene dispersion with two different concentrations (0.004 and 0.008 mg/mL) and two different thicknesses (10 and 20 mm). According to the experimental results, it can be seen that the graphene–carbon tetrachloride dispersion has an obvious optical limiting effect at 3.8 µm. In the next section, we will try to find out the reason for the optical limiting effect.
| Number | Concentration (mg/mL) | Thickness (mm) | Linear Transmittance | Minimum Transmittance | Limiting Threshold ( | |
|---|---|---|---|---|---|---|
| 1 | 0.004 | 10 | 75.2% | 36.5% | 0.387 | 0.13 |
| 2 | 0.004 | 20 | 68.7% | 29.6% | 0.391 | 0.14 |
| 3 | 0.008 | 10 | 69.7% | 29.2% | 0.405 | 0.14 |
| 4 | 0.008 | 20 | 62.1% | 26.4% | 0.356 | 0.15 |
Table 2. Experimental Results of Graphene Dispersion
4. Theoretical Discussion
According to the existing experimental results at other wavelengths, we know that the NOL mechanisms of graphene dispersions are complex, including nonlinear scattering, antisaturable absorption, and multiphoton absorption[18]. When the concentration of graphene dispersion is not very high, the main nonlinear effect is Mie scattering[19]. According to the theory of standard Mie scattering, each scattering source in the graphene dispersion can be equivalent to the standard sphere model. The extinction cross section , scattering cross section , and absorbing cross section of a single scattering source can be, respectively, expressed as[20]
When Mie scattering effects occur in the graphene dispersion, according to the Beer–Lambert law, the transmittance is given by [22,23]
According to Eqs. (2)–(7), we can obtain the relationship between the transmittance and the bubble radius . The transmittances of graphene dispersions changing with the bubble radius and input fluence are shown in Fig. 5. In Fig. 5, the relationship between the calculated transmittance and the bubble radius corresponding to each experimental case is represented by a solid curve. At a relatively low incident laser energy density, the radius of the bubble gradually increases with the increase of the input fluence. In addition, when comparing the four graphs in Fig. 5, it can be found that when Mie scattering occurs, under the same transmittance, the higher the dispersion concentration, the smaller the bubble radius[24]. For this phenomenon, the possible reason is that with the increase of concentration, the number of bubbles generated in the dispersion also increases sharply, and many bubbles have been replaced by new bubbles before they expand, so the average radius of the bubbles decreases significantly[25,26]. Comparing the theoretical curve and the experimental results in the four figures, we find the Mie scattering theory is in good agreement with our experimental results, which indicates that the main optical limiting mechanism of graphene dispersions in carbon tetrachloride at 3.8 µm wavelength is Mie scattering.
![]()
Figure 5.Transmittance changes with incident fluence (solid dots) and bubble radius (solid line) under different sample thicknesses and concentrations. (a) 10 mm, 0.004 mg/mL; (b) 20 mm, 0.004 mg/mL; (c) 10 mm, 0.008 mg/mL; (d) 20 mm, 0.008 mg/mL.
According to Eqs. (2)–(4), we can calculate the nonlinear scattering coefficient and nonlinear absorption coefficient under different bubble radii. The calculated results for the graphene dispersions at the concentration of 0.004 mg/mL and the thickness of 10 mm are shown in Fig. 6. As shown in Fig. 6, when the bubble radius is small (less than 100 nm), the absorption coefficient is several orders of magnitude larger than the scattering coefficient. With the increase of incident energy density, the growth rate of the scattering coefficient is much faster than that of the absorption coefficient, and the scattering coefficient is finally greater than that of the absorption coefficient. When the bubble radius is larger than 250 nm, the scattering coefficient is larger than the absorption coefficient, and the transmittance change of the suspension is mainly due to scattering. This calculation result further indicates that the main optical limiting mechanism of graphene dispersions in carbon tetrachloride at 3.8 µm wavelength is Mie scattering. The theoretical calculation results shown in the Figs. 5 and 6 are also consistent with our analysis results in Section 3.
![]()
Figure 6.Scattering and absorption coefficients versus bubble radius.
According to the experimental results, we can find when the concentration of graphene dispersions in carbon tetrachloride is 0.004 mg/mL and the thickness is 20 mm, the optical limiting capacity coefficient is 0.405, and the minimum transmittance is 0.292. In Table 3, we compare graphene dispersions in carbon tetrachloride with some other optical limiting materials. Although the values of and of graphene dispersion at the mid-infrared region are worse than those of some fiber[15], it is still better than those of some other optical limiting materials such as graphene oxide dispersion[27], special optical glass[28], and nonlinear optical crystals[29]. These results show that graphene dispersions in carbon tetrachloride have an excellent optical limiting effect in the mid-infrared region.
| Materials | Wavelength | References | ||
|---|---|---|---|---|
| Graphene dispersions in carbon tetrachloride | 0.405 | 0.292 | 3.8 µm | This article |
| 0.5 m | 0.893 | 0.123 | 3.6 µm | [ |
| Graphene oxide dispersions in N-methylpyrrolidone | 0.385 | 0.423 | 1.75 µm | [ |
| Graphene oxide Ormosil glasses | 0.316 | 0.184 | 1.57 µm | [ |
| 0.286 | 0.591 | 4.1 µm | [ |
Table 3. Comparison of Optical Limiting Properties of Several Materials
5. Conclusion
In summary, we present a new graphene dispersion in carbon tetrachloride, and experimentally research the NOL effect of the dispersion at the wavelength of 3.8 µm. The transmittances of graphene dispersion under two concentrations (0.004 and 0.008 mg/mL) and two solution thicknesses (10 and 20 mm) are measured experimentally. The influence of concentration and thickness on the optical limiting ability of graphene dispersion is analyzed. The experimental results show that graphene dispersion has good limiting performance for a pulsed laser with a typical infrared wavelength of 3.8 µm. Further, the experimental data indicate that the optical limiting effect of the graphene dispersion is mainly due to Mie scattering. The limiting capacity coefficient of the graphene dispersions in carbon tetrachloride reaches 0.405, and the minimum transmittance reaches 0.292. The results show graphene dispersion may be a promising material for NOL at the wavelength of 3.8 µm.
References
[1] S. Flom, G. Beadie, S. Bayya, B. Shaw, J. Auxier. Ultrafast Z-scan measurements of nonlinear optical constants of window materials at 772, 1030, and 1550 nm. Appl. Opt., 54, F123(2015).
[2] M. Alam, I. Leon, R. Boyd. Large optical nonlinearity of indium tin oxide in its epsilon-near-zero region. Science, 352, 795(2016).
[3] S. Saeidi, K. Awan, L. Sirbu, K. Dolgaleva. Nonlinear photonics on-a-chip in III–V semiconductors: quest for promising material candidates. Appl. Opt., 56, 5532(2017).
[4] L. Cai, A. Mahmoud, M. Khan, M. Mahmoud, T. Mukherjee, J. Bain, G. Piazza. Acousto-optical modulation of thin film lithium niobate waveguide devices. Photonics Res., 07, 1003(2019).
[5] D. Cotter, R. Manning, K. Blow, A. Ellis, A. Kelly, D. Nesset, I. Phillips, A. Poustie, D. Rogers. Nonlinear optics for high-speed digital information processing. Science, 286, 1523(1999).
[6] Y. Sun, J. Riggs. Organic and inorganic optical limiting materials: from fullerenes to nanoparticles. Int. Rev. Phys. Chem., 18, 43(1999).
[7] J. Liu, C. Wang, F. Gel’mukhanov. Dynamics of multilevel molecules and pulse propagation beyond rotating wave approximation near two-photon resonance. Phys. Rev. A, 76, 043422(2007).
[8] Y. Chen, J. Liu, M. Huang. Study on the spectral properties and optical limiting performance of a new fluorene derivative. Acta Opt. Sin., 32, 0216002(2012).
[9] H. Song, L. Yan, J. Si, X. Hou. Optical limiter for ultrashort laser pulses based on ultrafast optical Kerr effect. Chin. J. Lasers, 42, 0217002(2015).
[10] R. Ganeev, A. Ryasnyansky, V. Redkorechev, K. Fostiropoulos, G. Priebe, T. Usmanov. Variations of nonlinear optical characteristics of C60 thin films at 532 nm. Opt. Commun., 225, 131(2003).
[11] R. Ganeev, G. Boltaev, R. Tugushev, T. Usmanov, M. Baba, H. Kuroda. Low- and high-order nonlinear optical characterization of C60-containing media. Eur. Phys. J. D, 64, 109(2011).
[12] Y. Zhang, Q. Zhu. Investigation of coupled third harmonic generation in one-dimensional defective nonlinear photonic crystals. Opt. Express, 15, 6908(2007).
[13] J. Wei, C. Xu, B. Dong, C. Qiu, C. Lee. Mid-infrared semimetal polarization detectors with configurable polarity transition. Nat. Photonics, 15, 614(2021).
[14] J. Yang, F. Gong, R. Liu, G. Li. Application and progress of mid-infrared laser in optoelectronic countermeasure field. Flight Control & Detection, 3, 34(2020).
[15] J. Huang, Y. Lu, Z. Wu, Y. Xie, C. He, J. Wu. Infrared broadband nonlinear optical limiting technology based on stimulated Brillouin scattering in As2Se3 fiber. Chin. Opt. Lett., 20, 031902(2022).
[16] Z. Wu, Y. Lu, Y. Zuo, F. Xu, D. Zuo. Optical limiting effect of C70 solution at 1064 nm. Appl. Opt., 59, 4371(2020).
[17] C. Bohren, D. Huffman. Absorption and Scattering of Light by Small Particles(1998).
[18] Y. Chen, T. Bai, N. Dong, F. Fan, S. Zhang, X. Zhuang, J. Sun, B. Zhang, X. Zhang, J. Wang, W. J. Blau. Graphene and its derivatives for laser protection. Prog. Mater Sci., 84, 118(2017).
[19] Y. Xie, Y. Lu, J. Huang, Z. Wu, F. Xu, D. Zuo. Nonlinear optical limiting effect of graphene dispersions at 1064 nm. Appl. Opt., 60, 8858(2021).
[20] M. Vainio, J. Karhu. Fully stabilized mid-infrared frequency comb for high-precision molecular spectroscopy. Opt. Express, 25, 4190(2017).
[21] C. Mätzler. MATLAB Functions for Mie Scattering and Absorption Version 2(2002).
[22] J. Wang, D. Früchtl, Z. Sun, J. N. Coleman, W. J. Blau. Control of optical limiting of carbon nanotube dispersions by changing solvent parameters. J. Phys. Chem. C, 114, 6148(2010).
[23] I. Belousova, N. Mironova, M. Yur’Ev. Theoretical investigation of nonlinear limiting of laser radiation power by suspensions of carbon particles. Opt. Spectrosc., 94, 86(2003).
[24] I. M. Belousova, N. G. Mironova, A. G. Scobelev. The investigation of nonlinear optical limiting by aqueous suspensions of carbon nanoparticles. Opt. Commun., 235, 445(2004).
[25] B. Zhao, J. M. Zhao, Z. M. Zhang. Enhancement of near-infrared absorption in graphene with metal gratings. Appl. Phys. Lett., 105, 031905(2014).
[26] J. Wang, Y. Hernandez, M. Lotya, J. N. Coleman, W. J. Blau. Broadband nonlinear optical response of graphene dispersions. Adv. Mater., 21, 2430(2009).
[27] N. Liaros, E. Koudoumas, S. Couris. Broadband near infrared optical power limiting of few layered graphene oxides. Appl. Phys. Lett., 104, 191112(2014).
[28] X. Sun, X. Hu, J. Sun, Z. Xie, S. Zhou, P. Chen. Broadband optical limiting and nonlinear optical graphene oxide co-polymerization Ormosil glasses. Adv. Compos. Hybrid Mater., 1, 397(2018).
[29] P. G. Schunemann, K. T. Zawilski, L. A. Pomeranz. Advances in nonlinear optical crystals for mid-infrared coherent sources. J. Opt. Soc. Am. B, 33, D36(2016).

Set citation alerts for the article
Please enter your email address
© Copyright 2018-2021 | Chinese Laser Press. All Rights Reserved 沪ICP备15018463号-20