
Lei YAO, Dongwang YANG, Yonggao YAN, Xinfeng TANG. Laser-induced Self-propagating High-temperature Synthesis of Skutterudite [J]. Journal of Inorganic Materials, 2023, 38(7): 815
- Journal of Inorganic Materials
- Vol. 38, Issue 7, 815 (2023)
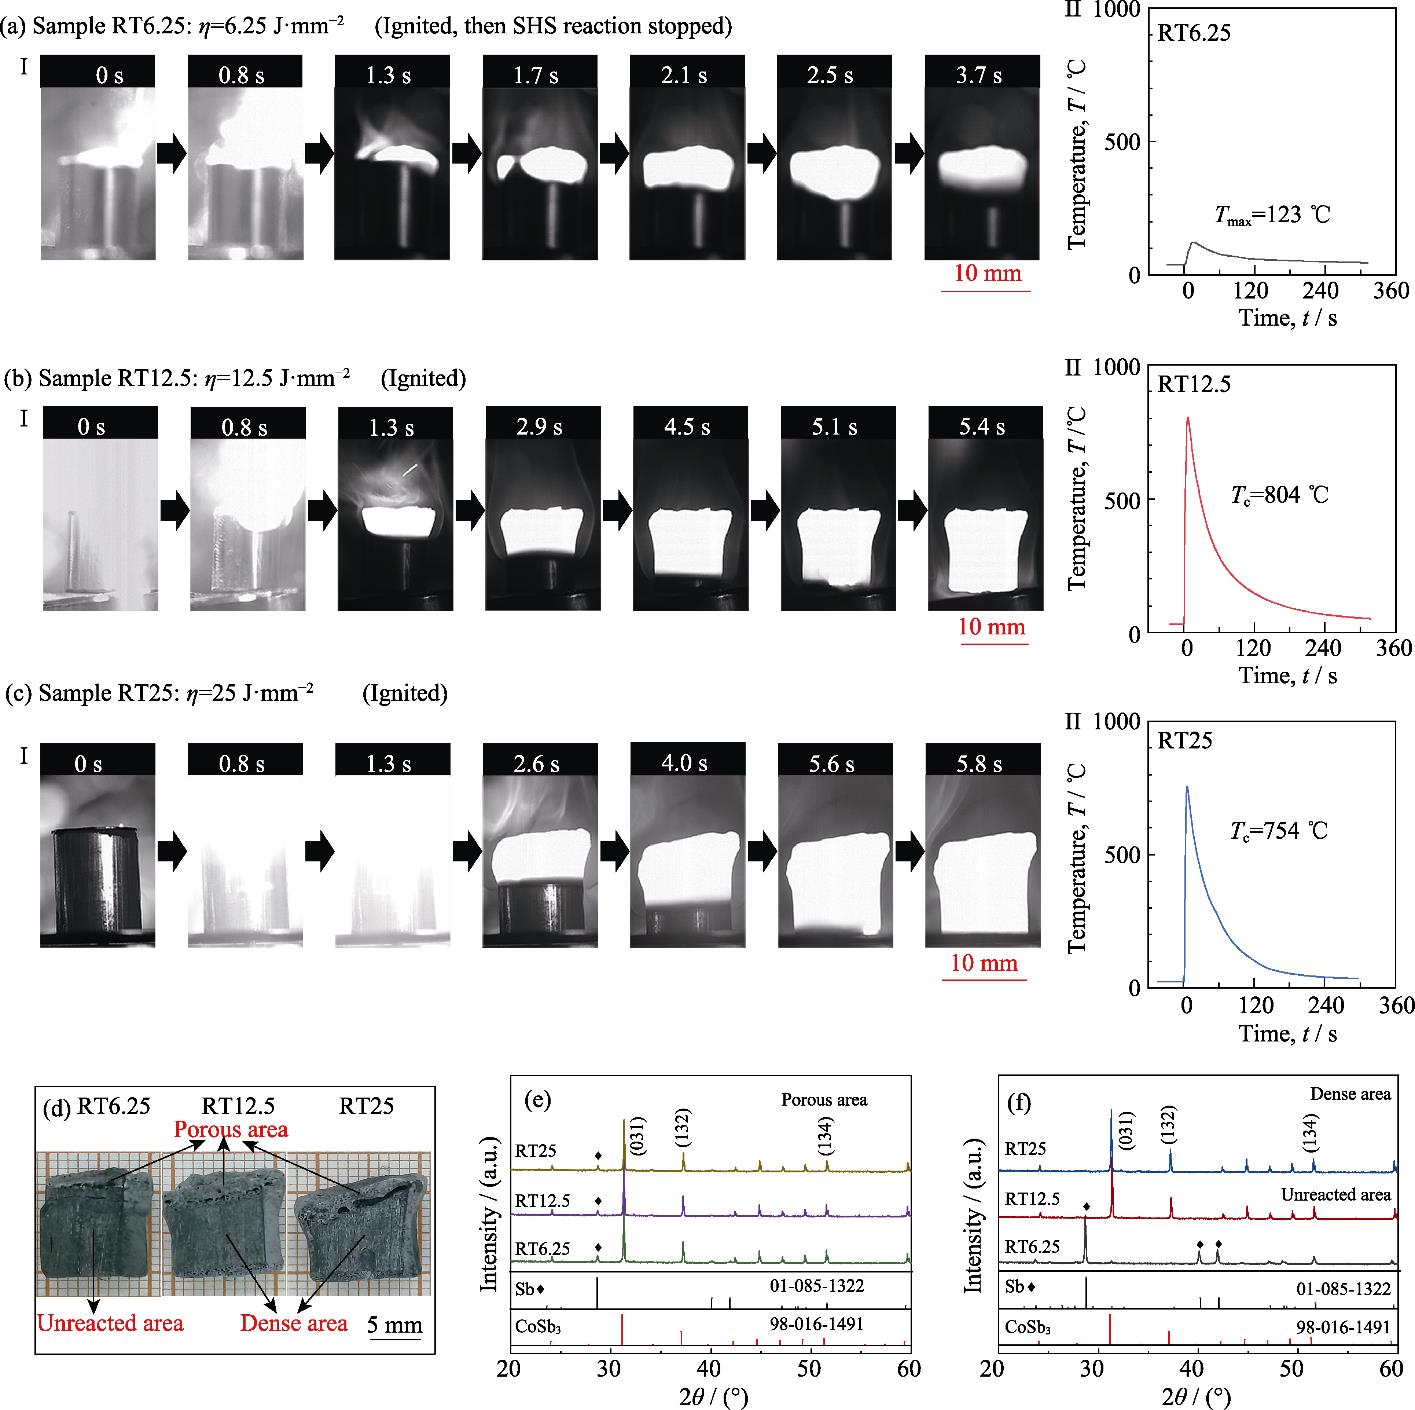
1. Laser-induced skutterudite SHS reaction process at room temperature
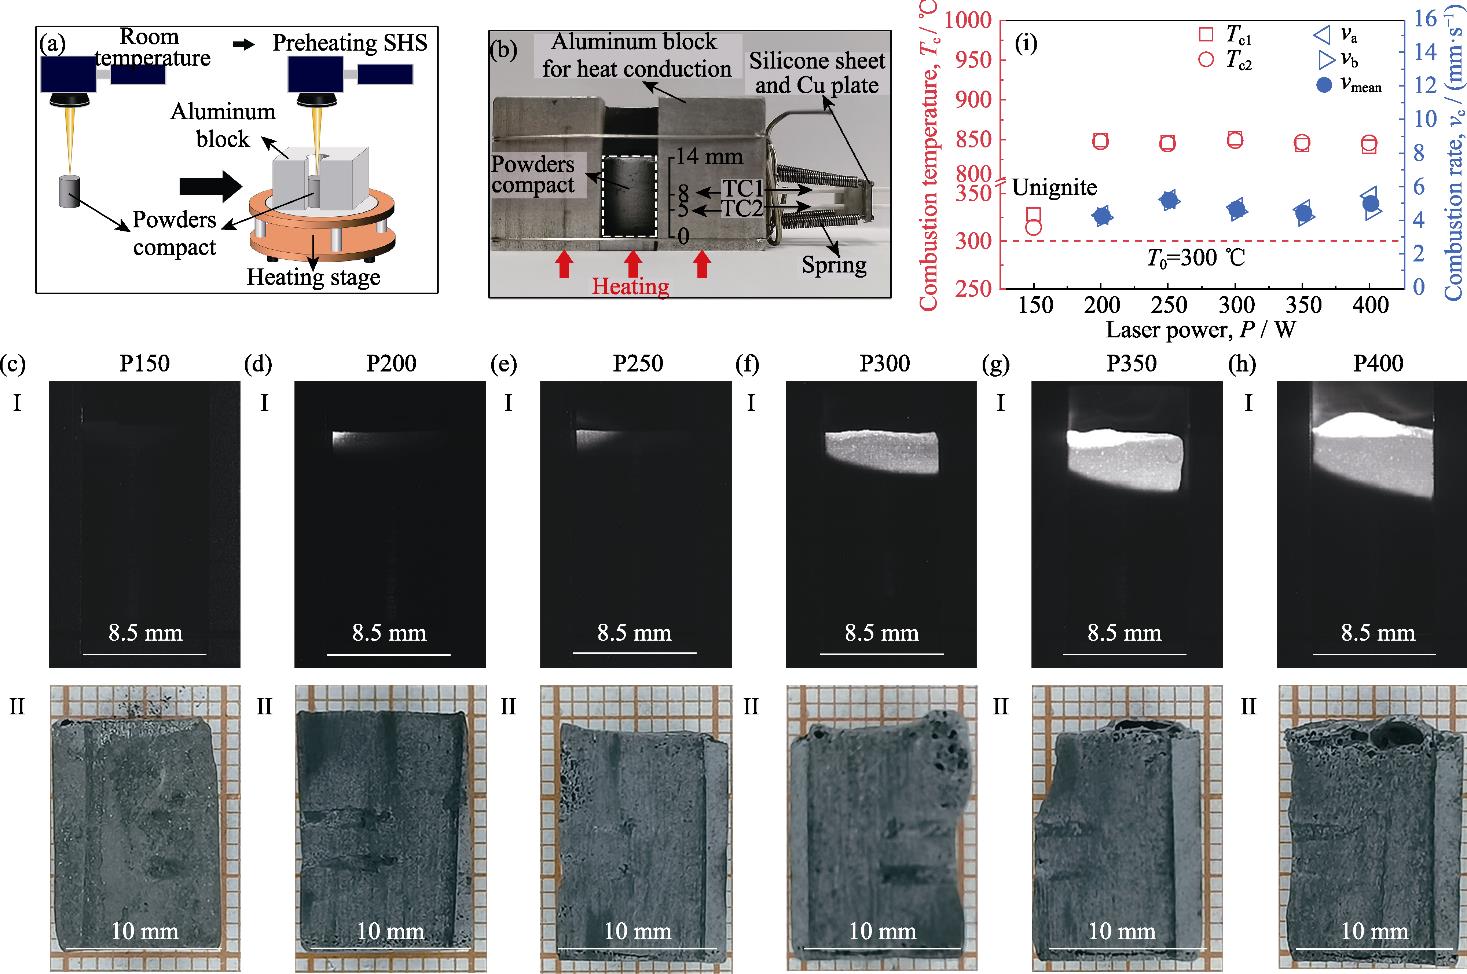
2. (a) Schematic diagram of room temperature and preheating SHS experiment; (b) Physical picture of the preheating module; (c-h) I. combustion wave front (t =0.95 s) and II. section photographs of powders compacts after SHS for sample Px (x =150, 200, 250, 300, 350, 400); (i) Trend graph of combustion temperature and combustion velocity changed with power density of ignition laser in CoSb3 system
3. Four typical SHS performances in CoSb3 system with different preheating temperatures
4. (a) Trend graph of combustion temperature changed with preheating temperature in CoSb3 system and (b) variation trend of combustion rate around region 3
5. XRD patterns of compact powders after SHS in different preheating temperature ranges
S1. Schematic diagram of the SHS device
S2. XRD patterns of samples RT6.25, RT12.5 and RT25
S3. Time-dependent temperature graphs of sample Px at the thermocouple TC1 (black) and TC2 (red)
S4. Time-dependent temperature graphs of sample Tx (x =150, 160, 170, 200, 210, 220, 230, 240, 250, 330, 350, 380, 400)
S5. SE, BSE images ((a, c)×200, (b, d) ×5000) of (a, b) sample P300 and (c, d) sample T400
|
Table 1. Laser ignition process for SHS samples at room temperature
|
Table 2. Laser ignition process of SHS samples under preheating condition
| |||||||||||||||||||||||||||||||||||||||||||||||||||||||||||||||||||||||||||||||||||||||||||||||||||||||||||||||||||||||||||||||||||||
Table 3. Area scanning and spot scanning results (Atomic percent) of samples P300 and T400

Set citation alerts for the article
Please enter your email address
© Copyright 2018-2021 | Chinese Laser Press. All Rights Reserved 沪ICP备15018463号-20