• Photonics Research
  • Vol. 8, Issue 10, 1613 (2020)
Luocheng Huang1,†, James Whitehead1,†, Shane Colburn1, and Arka Majumdar1,2,*
Author Affiliations
  • 1Department of Electrical and Computer Engineering, University of Washington, Seattle, Washington 98195, USA
  • 2Department of Physics, University of Washington, Seattle, Washington 98195, USA
  • show less
    DOI: 10.1364/PRJ.396839 Cite this Article Set citation alerts
    Luocheng Huang, James Whitehead, Shane Colburn, Arka Majumdar, "Design and analysis of extended depth of focus metalenses for achromatic computational imaging," Photonics Res. 8, 1613 (2020) Copy Citation Text show less
    EDOF metasurface design and measurements. (A) The phase masks of an ordinary metalens and four different EDOF metasurfaces. (B) Scanning electron micrographs of the fabricated metasurfaces. Inset shows the pillar distribution. (C) We experimentally measured the intensity along the optical axis where panels from top to bottom represent illumination by 625 nm, 530 nm, and 455 nm wavelengths. A cross section on the y–z plane is taken for each of the 3D PSFs.
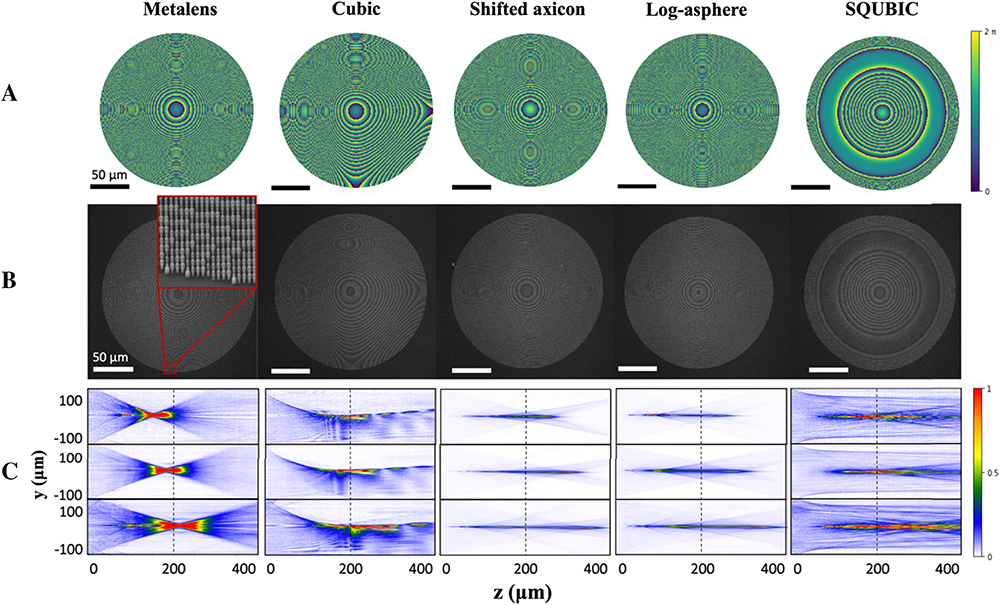
    Fig. 1. EDOF metasurface design and measurements. (A) The phase masks of an ordinary metalens and four different EDOF metasurfaces. (B) Scanning electron micrographs of the fabricated metasurfaces. Inset shows the pillar distribution. (C) We experimentally measured the intensity along the optical axis where panels from top to bottom represent illumination by 625 nm, 530 nm, and 455 nm wavelengths. A cross section on the yz plane is taken for each of the 3D PSFs.
    Characterization of the metasurfaces. The PSFs of the singlet metasurfaces were measured under (A) 455 nm blue, (B) 530 nm green, and (C) 625 nm red. The corresponding x–y plane cross sections of the experimental MTFs are displayed with red lines from its PSF measured under red light, green lines under green light, and blue lines under blue light. (D) The x–y plane cross sections of the theoretical MTFs are displayed in row (E). The scale bar signifies 25 μm. The MTF plots have a spatial frequency normalized to 560 cycles/mm.
    Fig. 2. Characterization of the metasurfaces. The PSFs of the singlet metasurfaces were measured under (A) 455 nm blue, (B) 530 nm green, and (C) 625 nm red. The corresponding xy plane cross sections of the experimental MTFs are displayed with red lines from its PSF measured under red light, green lines under green light, and blue lines under blue light. (D) The xy plane cross sections of the theoretical MTFs are displayed in row (E). The scale bar signifies 25 μm. The MTF plots have a spatial frequency normalized to 560 cycles/mm.
    Simulated imaging performance after deconvolution. Deconvolved images captured by the EDOF imaging system, using the simulated images and PSFs. The experimental counterpart can be found in Fig. 4.
    Fig. 3. Simulated imaging performance after deconvolution. Deconvolved images captured by the EDOF imaging system, using the simulated images and PSFs. The experimental counterpart can be found in Fig. 4.
    Imaging performance. Restored images taken from (A) an OLED display of colored letters in ROYGBVWG, (B) a colorful neighborhood, and (C) vibrant umbrellas against the sky. The scale bar signifies 20 μm. Note that the metalens images are raw and unrestored.
    Fig. 4. Imaging performance. Restored images taken from (A) an OLED display of colored letters in ROYGBVWG, (B) a colorful neighborhood, and (C) vibrant umbrellas against the sky. The scale bar signifies 20 μm. Note that the metalens images are raw and unrestored.
    Full color SSIM. The restored captures are scaled, rotated, and translated to align with the ground truth; then SSIM is calculated for each color channel for the metasurface.
    Fig. 5. Full color SSIM. The restored captures are scaled, rotated, and translated to align with the ground truth; then SSIM is calculated for each color channel for the metasurface.
    Phase (dashed lines) and amplitude (solid lines) response of the nanopillars, simulated using RCWA.
    Fig. 6. Phase (dashed lines) and amplitude (solid lines) response of the nanopillars, simulated using RCWA.
    Simulated captured images before deconvolution. The experimental counterpart is shown in Fig. 9.
    Fig. 7. Simulated captured images before deconvolution. The experimental counterpart is shown in Fig. 9.
    SSIM values when different regularization parameters are utilized.
    Fig. 8. SSIM values when different regularization parameters are utilized.
    Raw images taken from an OLED display of colored letters in (A) ROYGBVWG, (B) a colorful neighborhood, and (C) vibrant umbrellas against the sky.
    Fig. 9. Raw images taken from an OLED display of colored letters in (A) ROYGBVWG, (B) a colorful neighborhood, and (C) vibrant umbrellas against the sky.
     MetalensLog-AsphereShifted AxiconCubicSQUBIC
    Bandwidth (nm)15.2233.3233.3112.1157.6
    Center Wavelength (nm)543.9553.0547.0540.9530.3
    Table 1. Imaging Bandwidth, Defined as the Bandwidth at One Half of the Maximum PSF Similarity Coefficient
     MetalensCubicLog-AsphereShifted AxiconSQUBIC
    Bandwidth (μm)104.4106.2105.0103.8101.8
    Table 2. Theoretical Bandwidths of EDOF Metasurfaces
     MetalensCubicLog-AsphereShifted AxiconSQUBIC
    Blue0.0060.0160.0090.0090.011
    Green0.0030.0120.0100.0100.005
    Red0.0500.0250.0140.0140.009
    Table 3. Exposure Durations for PSF (in Seconds)
     MetalensCubicLog-AsphereShifted AxiconSQUBIC
    Exposure7.07.015.015.07.0
    Table 4. Exposure Durations for Imaging (in Seconds)
     MetalensCubicShifted AxiconLog-AsphereSQUBIC
    Blue0.1690.4400.4450.3920.502
    Green0.4640.3340.3610.3400.338
    Red0.1150.2590.2920.2610.131
    Table 5. SSIM on Simulation-Restored Images
     MetalensCubicShifted AxiconLog-AsphereSQUBIC
    Blue10.719.719.617.720.9
    Green21.318.918.517.418.1
    Red11.818.418.317.113.7
    Table 6. PSNR on Simulation-Restored Images (in dB)
     MetalensCubicShifted AxiconLog-AsphereSQUBIC
    Blue0.1010.3170.3220.3120.385
    Green0.4450.3240.3360.3240.315
    Red0.1370.3170.3590.3140.197
    Table 7. SSIM on Simulation-Restored Images (Gray-Scale Ground Truth)
     MetalensCubicLog-AsphereShifted AxiconSQUBIC
    Blue80.1%57.7%38.2%44.1%24.9%
    Green84.0%58.5%34.9%42.0%18.4%
    Red75.6%74.2%38.2%40.0%38.4%
    Table 8. Diffraction Efficiencies of the Metasurfaces
     MetalensCubicLog-AsphereShifted AxiconSQUBIC
    Blue9.715.715.415.916.5
    Green12.814.114.514.513.5
    Red13.113.113.913.813.1
    Table 9. Peak Signal-to-Noise Ratio (PSNR) in dB
    Luocheng Huang, James Whitehead, Shane Colburn, Arka Majumdar, "Design and analysis of extended depth of focus metalenses for achromatic computational imaging," Photonics Res. 8, 1613 (2020)
    Download Citation