
Xinyu Sun, Feng Qiu. Polarization independent high-speed spatial modulators based on an electro-optic polymer and silicon hybrid metasurface[J]. Photonics Research, 2022, 10(12): 2893
- Photonics Research
- Vol. 10, Issue 12, 2893 (2022)
![(a) 3D illustration of the proposed structure. The structure consists of an Au back plane, EO polymer (structure of the used chromophore is shown inside), and a thin ITO film on the designed Si metasurface. Unit cell dimensions are: w=0.35 μm, h=0.33 μm, P=px=py=0.905 μm. Thicknesses of ITO, Au back plane, and EO polymer are 0.1 μm, 0.1 μm, and 1.75 μm, respectively. (b) Simulated reflectance versus the working wavelength and EO polymer thickness. Horizontal dashed line indicates the optimized thickness of EO polymer of devices for high Q and large extinction ratio. (c) Reflective spectrum with the optimized EO polymer thickness. (d), (e) Spatial profile of the z component electric field R [Ez/E0] and x component electric field R [Ex/E0] at the resonant wavelength of 1358.1 nm (mode 1). (f), (g) Spatial profile of the z component electric field R [Ez/E0] and x component electric field R [Ex/E0] at the resonant wavelength of 1324.6 nm (mode 2).](/richHtml/prj/2022/10/12/2893/img_001.jpg)
Fig. 1. (a) 3D illustration of the proposed structure. The structure consists of an Au back plane, EO polymer (structure of the used chromophore is shown inside), and a thin ITO film on the designed Si metasurface. Unit cell dimensions are: w = 0.35 μm h = 0.33 μm P = p x = p y = 0.905 μm Q and large extinction ratio. (c) Reflective spectrum with the optimized EO polymer thickness. (d), (e) Spatial profile of the z R E z / E 0 x R E x / E 0 z R E z / E 0 x R E x / E 0
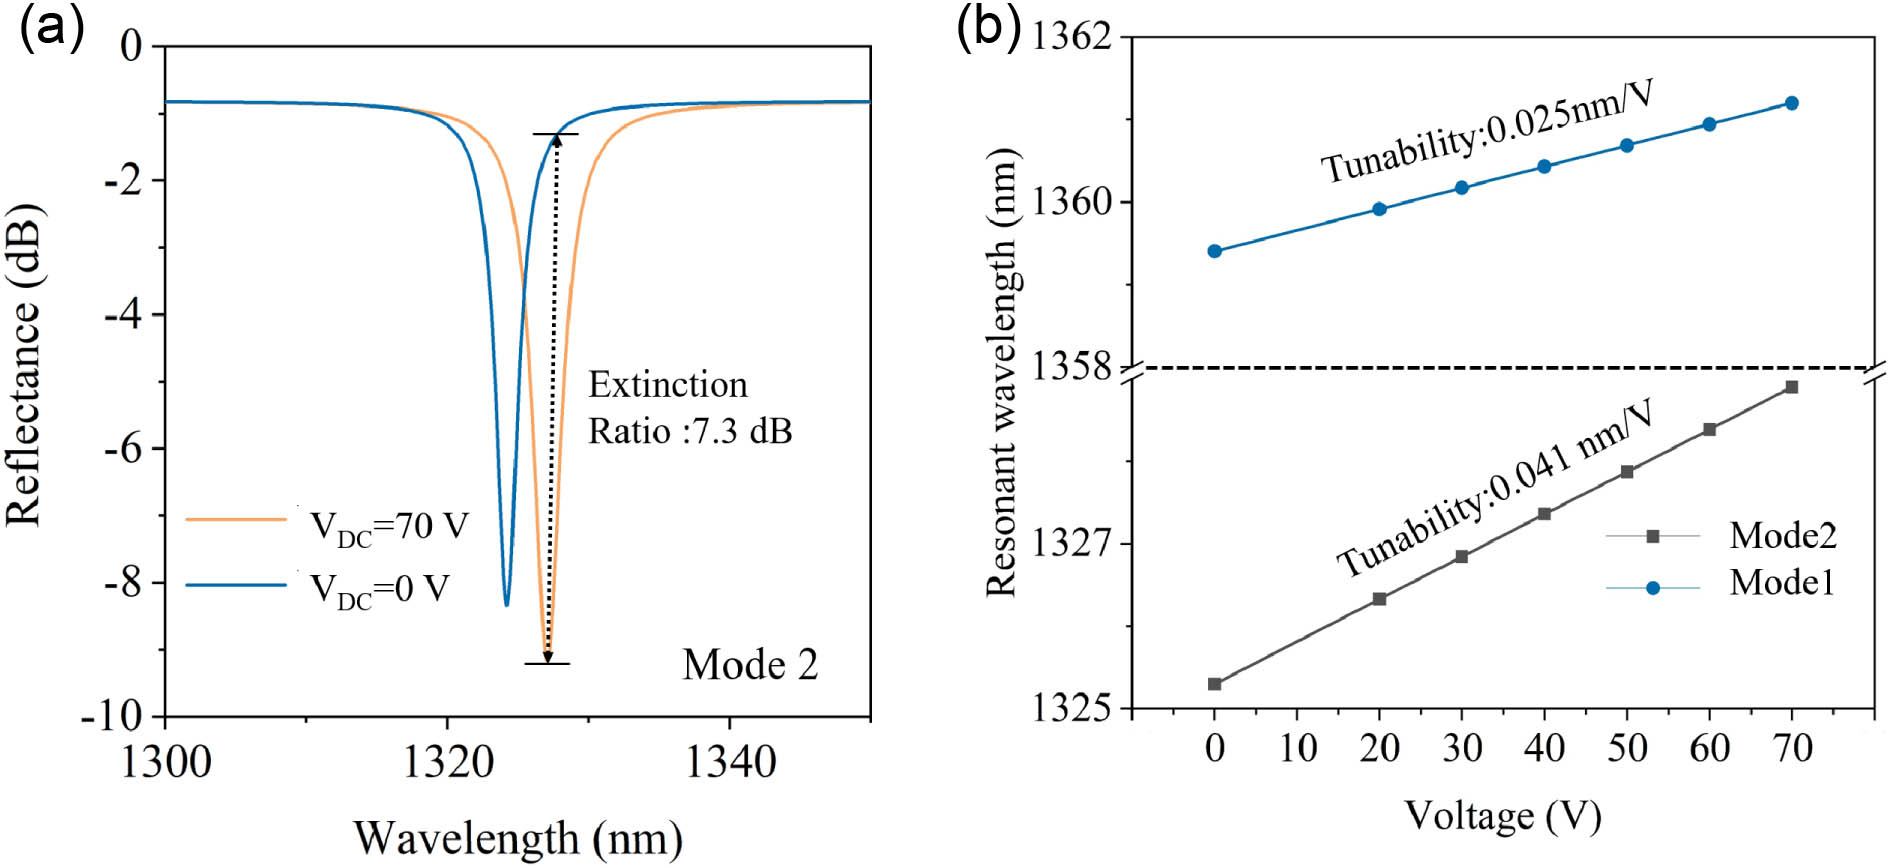
Fig. 2. (a) Simulated reflective spectrum with unbiased and 70 V voltage. (b) Shift of the resonance wavelength linearly fitted with the bias voltages of mode 1 and mode 2.
Fig. 3. (a) Schematic of the experimental process to demonstrate the polarization independence property of the modulators. (b) Scanning electron microscopy images of Si square pillars on ITO layer before spin-coating EO polymer. (c) Resonant spectra under incident light with different polarization states (without applied bias).
Fig. 4. Measured reflective spectra, tunability, and extinction ratio under different polarizations: (a)–(c) mode 2; (d)–(f) mode 1. (g) Measured high-speed reflectance modulation (blue) upon 15 dBm RF signal (black) with operation speed of 400 MHz.
Fig. 5. (a)–(d) Parametric analysis on the width and period of Si square particles. The black dotted line represents the optimized configuration used in the final discussion with width of 0.35 μm period of 0.905 μm
Fig. 6. (a) Calculated eigenfrequency of different modes with different thicknesses of EO polymer. (b) Simulated reflectance with different thicknesses of EO polymer.
Fig. 7. Custom-built optical system for measuring the reflectance spectra of the device.
Fig. 8. Custom-built optical system and high-frequency RF modulation measurement system.
Fig. 9. Measured data of refractive index and absorption coefficient of ITO.
|
Table 1. Comparison of Different Types of Electrically Driven SLMs

Set citation alerts for the article
Please enter your email address
© Copyright 2018-2021 | Chinese Laser Press. All Rights Reserved 沪ICP备15018463号-20