
Lu-Bing Jiang, Ning-Xuan Li, Kai Ji. Formation and suppression of nonthermal statistics in peridically driven quantum Ising models [J]. Acta Physica Sinica, 2020, 69(14): 140501-1
- Acta Physica Sinica
- Vol. 69, Issue 14, 140501-1 (2020)
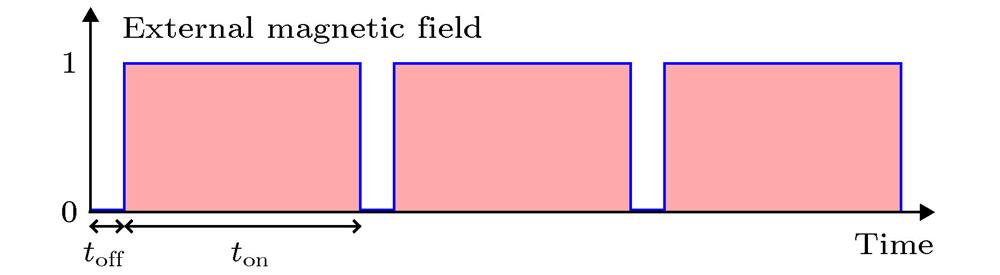
Fig. 1. Schematic plot of external magnetic field intensity with a periodic change.
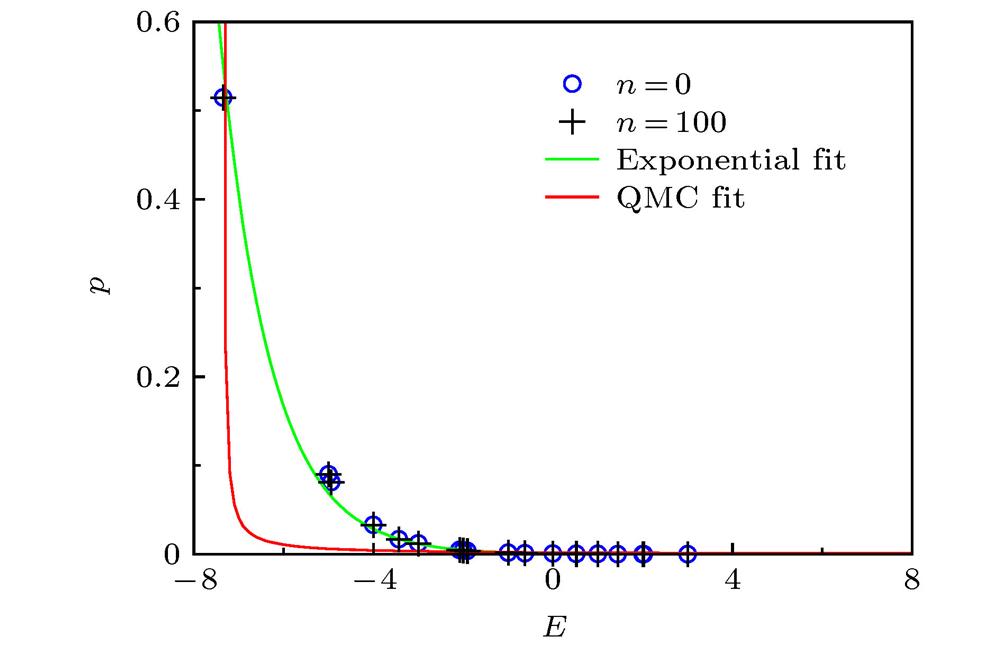
Fig. 2. The eigenstate occupation numbers of one-dimensional Ising model keep invariant under longitudinal periodic magnetic pulses (along the
 -axis). Here
 is the number of magnetic pulses, each point in the graph represents the mean of 32 neighboring states, the green and red curves are the exponential and QMC fitting results, respectively.
-axis). Here
is the number of magnetic pulses, each point in the graph represents the mean of 32 neighboring states, the green and red curves are the exponential and QMC fitting results, respectively. Fig. 3. DOS of one-dimensional Ising model. Thick red curve: Ising model without external field; blue curve: Ising model with a longitudinal field; thin green curve: Ising model with a transverse field.
Fig. 4. Distribution of eigenstate occupation numbers of one-dimensional Ising model after
 periodic transverse (along
 x -axis) magnetic pulses: (a) n = 0; (b) n = 2; (c) n = 16; (d) n = 103. Each point in the graph represents the mean of 32 states, the green and red curves are the exponential and QMC fitting results, respectively.
periodic transverse (along Fig. 5. Distribution of eigenstate occupation numbers: (a) n = 0; (b) n = 4; (c) n = 14; (d) n = 100. The situation is similar to that of Fig. 4 except for the introduction of weak random local magnetic fields.
Fig. 6. Information entropy of the Floquet eigenstates in the eigenstate representation of
 for the one-dimensional Ising model under transverse (along
 x -axis) periodic magnetic pulses: (a) Systems without random local magnetic fields; (b) systems with random local magnetic fields, where the red, green, and blue points correspond to magnetic pulse interval
 , respectively, and the black dashed lines are the distribution of information entropy for the one-dimensional Ising model under longitudinal (along
 z -axis) periodic magnetic pulses.
for the one-dimensional Ising model under transverse (along , respectively, and the black dashed lines are the distribution of information entropy for the one-dimensional Ising model under longitudinal (along Fig. 7. Average energy per spin versus pulse number n for the one-dimensional Ising model under transverse (along x -axis) periodic magnetic pulses: (a) Systems without random local magnetic fields; (b) systems with random local magnetic fields, where the red squares, green circles, and blue triangles correspond to magnetic pulse interval
 , respectively, and the black dashed lines are the average energy per spin for the one-dimensional Ising model under longitudinal (along
 z -axis) periodic magnetic pulses.
, respectively, and the black dashed lines are the average energy per spin for the one-dimensional Ising model under longitudinal (along 
Set citation alerts for the article
Please enter your email address
© Copyright 2018-2021 | Chinese Laser Press. All Rights Reserved 沪ICP备15018463号-20