• Chinese Optics Letters
  • Vol. 22, Issue 3, 031702 (2024)
Xing Long1, Yicheng Hu1, Yibing Wang1, and Changhui Li1、2、*
Author Affiliations
  • 1Department of Biomedical Engineering, College of Future Technology, Peking University, Beijing 100871, China
  • 2National Biomedical Imaging Center, Peking University, Beijing 100871, China
  • show less
    DOI: 10.3788/COL202422.031702 Cite this Article Set citation alerts
    Xing Long, Yicheng Hu, Yibing Wang, Changhui Li. Noncontact ultrasound sensing based on Mach–Zehnder homodyne interferometer for photoacoustic imaging[J]. Chinese Optics Letters, 2024, 22(3): 031702 Copy Citation Text show less
    Schematic of noncontact US detection system. ① 1550 nm continuous laser; ② FC/APC fiber collimators; ③ true zero-order half-wave plate; ④ polarization beam splitter; ⑤ mirror attached on piezoelectric stacks; ⑥⑦ optical isolator; ⑧ a convex lens with a focal length of 40 mm; ⑨ beam splitter; ❿ FC/PC fiber collimators; ⑪ optical fibers; ⑫ balanced photodetector.
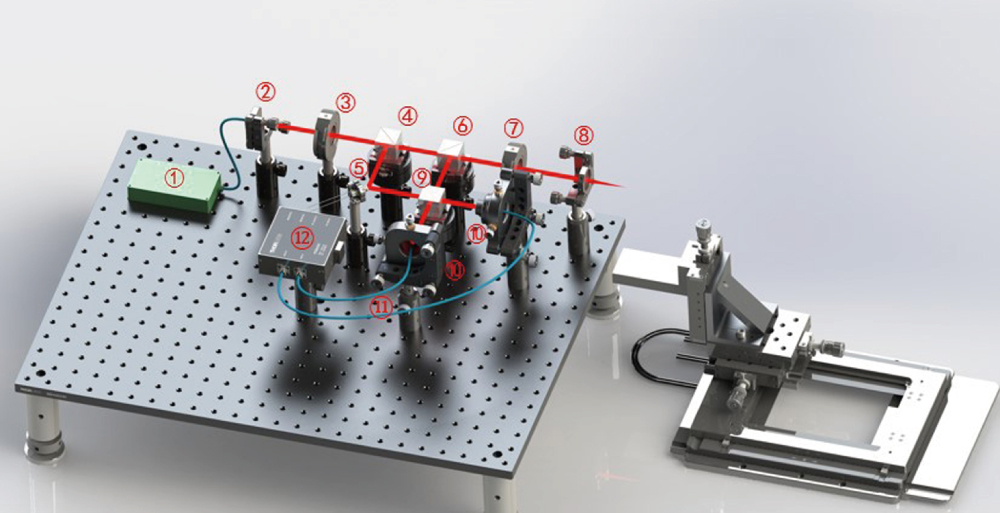
    Fig. 1. Schematic of noncontact US detection system. 1550 nm continuous laser; FC/APC fiber collimators; true zero-order half-wave plate; polarization beam splitter; mirror attached on piezoelectric stacks; optical isolator; a convex lens with a focal length of 40 mm; beam splitter; FC/PC fiber collimators; optical fibers; balanced photodetector.
    Noncontact PACT system setup. NDF, neutral density filter; HWP, half-wave plate; PBS, polarization beam splitter; M, mirror; BS, beam splitter; QWP, quarter-wave plate; L, lens; FC, fiber collimator; OF, optical fiber; BPD, balanced photodetector; PD, photodiode; DAQ, data acquisition card.
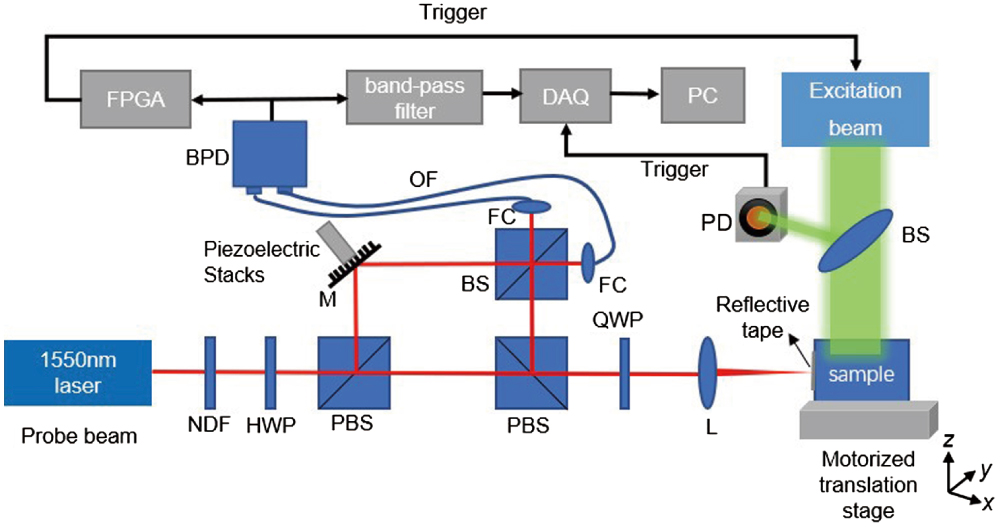
    Fig. 2. Noncontact PACT system setup. NDF, neutral density filter; HWP, half-wave plate; PBS, polarization beam splitter; M, mirror; BS, beam splitter; QWP, quarter-wave plate; L, lens; FC, fiber collimator; OF, optical fiber; BPD, balanced photodetector; PD, photodiode; DAQ, data acquisition card.
    Sensitivity determination of NCUS system. (a) Schematic of sensitivity determination (including the microscopic view of the reflective tape); (b) temporal and corresponding frequency response curve of NCUS system to 5 MHz US through a 0.75–10 MHz bandpass filter.
    Fig. 3. Sensitivity determination of NCUS system. (a) Schematic of sensitivity determination (including the microscopic view of the reflective tape); (b) temporal and corresponding frequency response curve of NCUS system to 5 MHz US through a 0.75–10 MHz bandpass filter.
    Schematic of PA signal response and bandwidth. (a) Schematic of laser-induced ultrasound (LUS) signal response of 20 µm thick black polyethylene wrap film; (b) detected PA time-domain signal and corresponding frequency-domain response of NCUS system.
    Fig. 4. Schematic of PA signal response and bandwidth. (a) Schematic of laser-induced ultrasound (LUS) signal response of 20 µm thick black polyethylene wrap film; (b) detected PA time-domain signal and corresponding frequency-domain response of NCUS system.
    (a) Schematic of PACT experiment by NCUS; (b) original signal of the 1000 detection elements with phase correction and 2 MHz high-pass filtering; (c) reconstruction results of one human hair with phase correction; (d) axial resolution of NCUS system is about 300 µm; (e) original signal of the 1000 detection elements with 2 MHz high-pass filtering without phase correction; (f) reconstruction results of one human hair. Scale bars: 2 mm.
    Fig. 5. (a) Schematic of PACT experiment by NCUS; (b) original signal of the 1000 detection elements with phase correction and 2 MHz high-pass filtering; (c) reconstruction results of one human hair with phase correction; (d) axial resolution of NCUS system is about 300 µm; (e) original signal of the 1000 detection elements with 2 MHz high-pass filtering without phase correction; (f) reconstruction results of one human hair. Scale bars: 2 mm.
    (a) Photograph of the crossed hair; (b) image reconstruction results of the crossed hair after passing through 2 MHz high-pass filter; (c) photograph of leaf vein skeleton; (d) image reconstruction results of leaf vein skeleton after passing through 1 MHz high-pass filter. Scale bars: 1 mm.
    Fig. 6. (a) Photograph of the crossed hair; (b) image reconstruction results of the crossed hair after passing through 2 MHz high-pass filter; (c) photograph of leaf vein skeleton; (d) image reconstruction results of leaf vein skeleton after passing through 1 MHz high-pass filter. Scale bars: 1 mm.
    Xing Long, Yicheng Hu, Yibing Wang, Changhui Li. Noncontact ultrasound sensing based on Mach–Zehnder homodyne interferometer for photoacoustic imaging[J]. Chinese Optics Letters, 2024, 22(3): 031702
    Download Citation