Author Affiliations
1Key Laboratory of Advanced Manufacturing Technology of the Ministry of Education, Guizhou University, Guiyang 550025, Guizhou, China2Information Engineering Institute, Chongqing Vocational and Technical University of Mechatronics, Chongqing 402760, Chinashow less
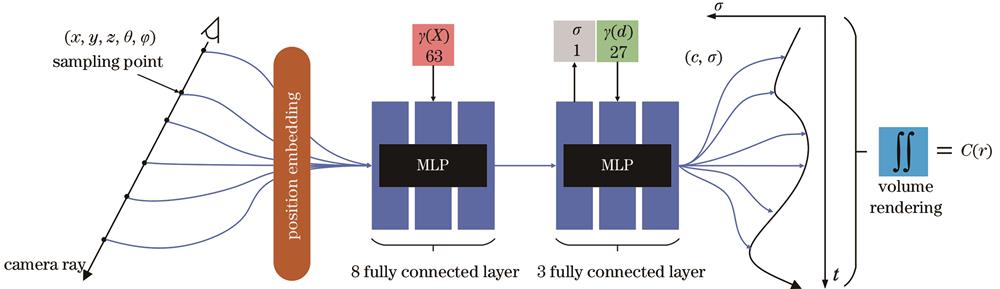
Fig. 1. Structure of NeRF network
Fig. 2. Structure of IP-NeRF network
Fig. 3. Multi-feature joint learning module
Fig. 4. Gated channel tranformation MLP module
Fig. 5. Visualized new view reconstruction results under the modules in Trex and Lego scenes
Fig. 6. Visualized new view reconstruction results of different methods in the selected scenes of the three datasets
| Ablation experiment | PSNR/dB | SSIM | LPIPS |
|---|
| A | 26.90(+0.37%) | 0.881(+0.11%) | 0.057 | | B | 28.23(+5.33%) | 0.925(+5.11%) | 0.051(-10.53%) | | C | 28.56(+6.56%) | 0.930(+5.68%) | 0.046(-19.30%) | | D | 28.74(+7.24%) | 0.934(+6.13%) | 0.042(-26.31%) |
|
Table 1. Ablation experiment of the new view reconstruction in Trex scene
| Ablation experiment | PSNR/dB | SSIM | LPIPS |
|---|
| A | 32.62(+0.24%) | 0.961 | 0.024 | | B | 33.94(+4.33%) | 0.968(+0.73%) | 0.017(-29.17%) | | C | 34.37(+5.62%) | 0.971(+1.04%) | 0.016(-33.33%) | | D | 34.77(+6.85%) | 0.974(+1.35%) | 0.015(-37.50%) |
|
Table 2. Ablation experiment of the new view reconstruction in Lego scene
| Scene | NeRF | NeRF-ID | IP-NeRF |
|---|
| PSNR/dB | SSIM | LPIPS | PSNR/dB | SSIM | LPIPS | PSNR/dB | SSIM | LPIPS |
|---|
| Mean | 31.01 | 0.947 | 0.041 | 32.34 | 0.957 | 0.029 | 32.75 | 0.960 | 0.026 | | Chair | 33.00 | 0.967 | 0.019 | 34.54 | 0.978 | 0.014 | 35.17 | 0.983 | 0.010 | | Drums | 25.01 | 0.925 | 0.058 | 25.15 | 0.926 | 0.057 | 25.80 | 0.931 | 0.051 | | Ficus | 30.13 | 0.964 | 0.022 | 32.24 | 0.976 | 0.015 | 31.86 | 0.973 | 0.016 | | Hotdog | 36.18 | 0.974 | 0.016 | 37.26 | 0.981 | 0.013 | 38.48 | 0.986 | 0.010 | | Lego | 32.54 | 0.961 | 0.024 | 34.73 | 0.974 | 0.015 | 34.77 | 0.974 | 0.015 | | Materials | 29.62 | 0.949 | 0.029 | 30.37 | 0.956 | 0.024 | 31.90 | 0.977 | 0.011 | | Mic | 32.91 | 0.980 | 0.023 | 34.71 | 0.988 | 0.009 | 34.21 | 0.982 | 0.018 | | Ship | 28.65 | 0.856 | 0.119 | 29.75 | 0.876 | 0.081 | 29.79 | 0.876 | 0.081 |
|
Table 3. Parameter comparison of different methods on Realistic Synthetic 360° dataset
| Scene | NeRF | NeRF-ID | IP-NeRF |
|---|
| PSNR /dB | SSIM | LPIPS | PSNR /dB | SSIM | LPIPS | PSNR /dB | SSIM | LPIPS |
|---|
| Mean | 26.50 | 0.811 | 0.073 | 26.76 | 0.822 | 0.070 | 28.08 | 0.887 | 0.061 | | Fern | 25.20 | 0.792 | 0.092 | 25.01 | 0.800 | 0.089 | 27.08 | 0.868 | 0.079 | | Flower | 27.40 | 0.827 | 0.061 | 27.85 | 0.842 | 0.058 | 28.82 | 0.901 | 0.053 | | Fortress | 31.16 | 0.881 | 0.030 | 31.51 | 0.888 | 0.028 | 32.94 | 0.933 | 0.024 | | Horns | 27.45 | 0.828 | 0.068 | 27.88 | 0.843 | 0.065 | 29.30 | 0.911 | 0.057 | | Leaves | 20.92 | 0.690 | 0.111 | 21.09 | 0.708 | 0.108 | 22.53 | 0.825 | 0.100 | | Orchids | 20.36 | 0.641 | 0.121 | 20.38 | 0.643 | 0.120 | 21.44 | 0.764 | 0.100 | | Room | 32.70 | 0.948 | 0.041 | 32.93 | 0.954 | 0.039 | 33.86 | 0.961 | 0.035 | | Trex | 26.80 | 0.880 | 0.057 | 27.45 | 0.897 | 0.051 | 28.74 | 0.934 | 0.042 |
|
Table 4. Parameter comparison of different methods on Real Forward-Facing dataset
| Scene | NeRF | NeRF-ID | IP-NeRF |
|---|
| PSNR /dB | SSIM | LPIPS | PSNR /dB | SSIM | LPIPS | PSNR /dB | SSIM | LPIPS |
|---|
Scan1 Scan22 Scan55 Scan109 | 23.49 | 0.754 | 0.282 | 23.80 | 0.765 | 0.266 | 24.47 | 0.778 | 0.248 | | 21.55 | 0.708 | 0.238 | 21.98 | 0.715 | 0.226 | 22.68 | 0.758 | 0.196 | | 26.54 | 0.794 | 0.229 | 26.76 | 0.800 | 0.219 | 27.23 | 0.812 | 0.206 | | 28.33 | 0.860 | 0.236 | 28.63 | 0.870 | 0.226 | 29.46 | 0.881 | 0.185 | | Mean | 24.98 | 0.779 | 0.246 | 25.29 | 0.787 | 0.234 | 25.96 | 0.807 | 0.208 |
|
Table 5. Parameter comparison of different methods on DTU dataset
| Dataset | NeRF | NeRF-ID | IP-NeRF |
|---|
| PSNR /dB | Train-time /h | Render-time /(s/it) | PSNR /dB | Train-time /h | Render-time /(s/it) | PSNR /dB | Train-time /h | Render-time/(s/it) |
|---|
| Realistic Synthetic 360° Real Forward-Facing DTU | 31.01 | 18.4 | 21.18 | 32.34 | 14.9 | 17.10 | 32.75 | 19.5 | 22.24 | | 26.50 | 16.5 | 20.10 | 26.76 | 13.3 | 16.17 | 28.08 | 17.5 | 21.20 | | 24.98 | 19.4 | 36.60 | 25.29 | 15.6 | 30.48 | 25.96 | 20.5 | 38.63 |
|
Table 6. Calculation cost comparison of different methods
| Dataset | NeRF-ID | SIP-NeRF |
|---|
| PSNR /dB | Train-time /h | Render-time /(s/it) | PSNR /dB | Train-time /h | Render-time /(s/it) |
|---|
| Realistic Synthetic 360° Real Forward-Facing DTU | 32.34 | 14.9 | 17.10 | 32.40 | 15.0 | 17.08 | | 26.76 | 13.3 | 16.17 | 27.68 | 13.3 | 16.10 | | 25.29 | 15.6 | 30.48 | 25.64 | 15.6 | 30.39 |
|
Table 7. Calculation cost comparison of simplified network
| Dataset | Parameter | NeRF[13] | NSVF[15] | GRF[17] | NeuSample[21] | NeXT[20] | IP-NeRF |
|---|
| Realistic Synthetic 360° | PSNR /dB | 31.01 | 31.75 | 32.06 | 31.15 | 34.40 | 32.75 | | Train-time/h | 18.4 | 1.5 | 23.0 | 14.0 | 52.7 | 19.5 | | Real Forward-Facing | PSNR /dB | 26.50 | / | 26.64 | 26.83 | / | 28.08 | | Train-time /h | 16.5 | / | 20.6 | 12.5 | / | 17.5 |
|
Table 8. Comprehensive performance analysis of different methods