Yang Zheng1、2, Zhengqiang Li1、2、3、*, Siheng Wang4、**, Yan Ma2, Kaitao Li1、2, Yuhuan Zhang5, Zhenhai Liu6, Leiku Yang7, Weizhen Hou2、3, Haoran Gu1、8, Yinna Li2、3, Qian Yao2、3, and Zhuo He2、3
Author Affiliations
1Hainan Aerospace Information Research Institute, Sanya 572032, Hainan, China2Aerospace Information Research Institute, State Environmental Protection Key Laboratory of Satellite Remote Sensing, Chinese Academy of Sciences, Beijing 100101, China3University of Chinese Academy of Sciences, Beijing 100049, China4China Academy of Space Technology, Remote Sensing Satellite General Department, Beijing 100094, China5Satellite Application Center for Ecology and Environment, MEE, Beijing 100094, China6Anhui Institute of Optics and Fine Mechanics, Hefei Institutes of Physical Science, Chinese Academy of Sciences, Hefei 230031, Anhui, China7School of Surveying and Land Information Engineering, Henan Polytechnic University, Jiaozuo 454003, Henan, China8College of Geography and Tourism, Anhui Normal University, Wuhu 241003, Anhui, Chinashow less
DOI: 10.3788/AOS221549
Cite this Article
Set citation alerts
Yang Zheng, Zhengqiang Li, Siheng Wang, Yan Ma, Kaitao Li, Yuhuan Zhang, Zhenhai Liu, Leiku Yang, Weizhen Hou, Haoran Gu, Yinna Li, Qian Yao, Zhuo He. Atmospheric Correction of Gaofen-2 Panchromatic Satellite Images[J]. Acta Optica Sinica, 2023, 43(6): 0601012
Copy Citation Text
show less
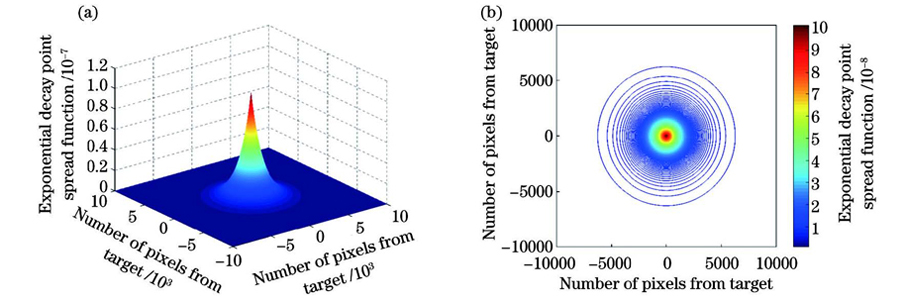
Fig. 1. Exponential decay point spread function varies with pixel distance when spatial resolution is 0.8 m. (a) Three-dimensional surface diagram; (b) contour image
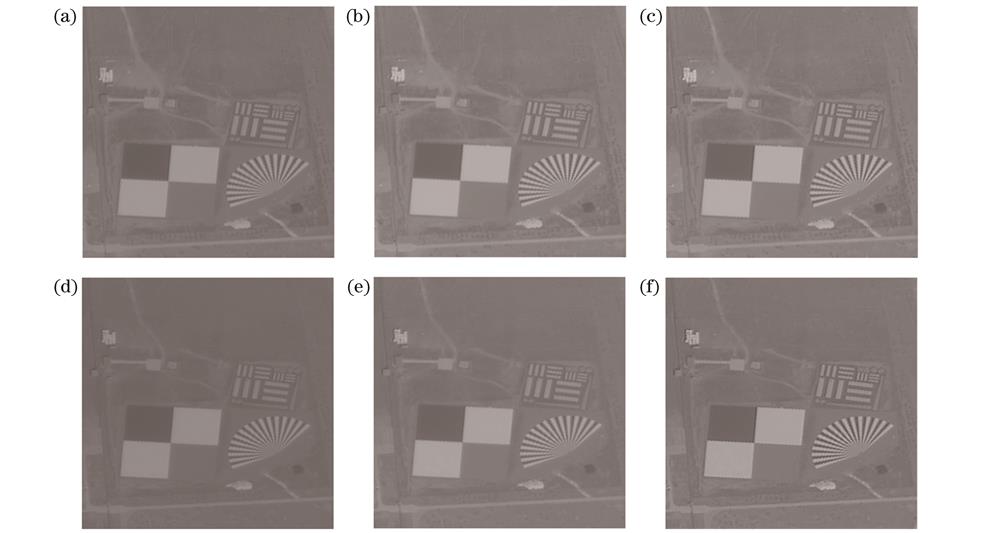
Fig. 2. GF-2 panchromatic band satellite images before and after atmospheric correction. Apparent reflectance images of (a) polluted atmosphere and (d) clean atmosphere before atmospheric correction; initial surface reflectance images of (b) polluted atmosphere and (e) clean atmosphere after atmospheric radiation correction; true surface reflectance images of (c) polluted atmosphere and (f) clean atmosphere after adjacency effect correction
Fig. 3. Comparison of clarity, contrast, edge energy, and detail energy of panchromatic band satellite images before and after atmospheric correction. (a) Clarity; (b) contrast; (c) edge energy; (d) detail energy
Fig. 4. MTF of panchromatic band satellite images before and after atmospheric correction. (a) Polluted atmosphere; (b) clean atmosphere
Imaging time | 2021-05-29T11:34:52 | 2021-08-16T11:34:01 |
---|
Solar zenith angle /() | 23.4457 | 31.3780 | Solar azimuth angle /() | 139.899 | 145.050 | Satellite zenith angle /() | 3.4875 | 3.4877 | Satellite azimuth angle /() | 96.2494 | 285.9640 | Aerosol model | Sun-photometer measurements | Sun-photometer measurements | | 0.1922 | 0.6689 | Water vapor content /(g·cm-2) | 0.8092 | 1.7115 | Ozone content /(g·cm-2) | 7.1709×10⁻⁴ | 6.3409×10⁻⁴ |
|
Table 1. Atmospheric parameters and observed geometric parameters of GF-2 panchromatic band image (450-900 nm)
Imaging time | 2021-05-29T11:34:52 | 2021-08-16T11:34:01 |
---|
of AERONET Baotou site | 0.1922 | 0.6689 | of MODIS | 0.128 | 0.653 |
|
Table 2. AOD of Terra MODIS product and AOD measured at AERONET Baotou site
Weather condition | Clarity improvement | Contrast improvement | Edge energy improvement | Detail energy improvement | Normalized MTF (normalized frequency is 0.5) |
---|
| | | | | | | | | |
---|
Clean weather | 139 | 155 | 108 | 115 | 192 | 247 | 190 | 204 | 104 | 169 | Polluted weather | 154 | 216 | 116 | 143 | 235 | 497 | 234 | 245 | 107 | 474 |
|
Table 3. Comparison of quantitative improvement of panchromatic band satellite images by atmospheric correction