
Rui-qian YE, Hao HE, Peng ZHENG, Meng-xi XU, Lei WANG. A Spike Removal Algorithm Based on Median Filter and Statistic for Raman Spectra[J]. Spectroscopy and Spectral Analysis, 2022, 42(10): 3174
- Spectroscopy and Spectral Analysis
- Vol. 42, Issue 10, 3174 (2022)
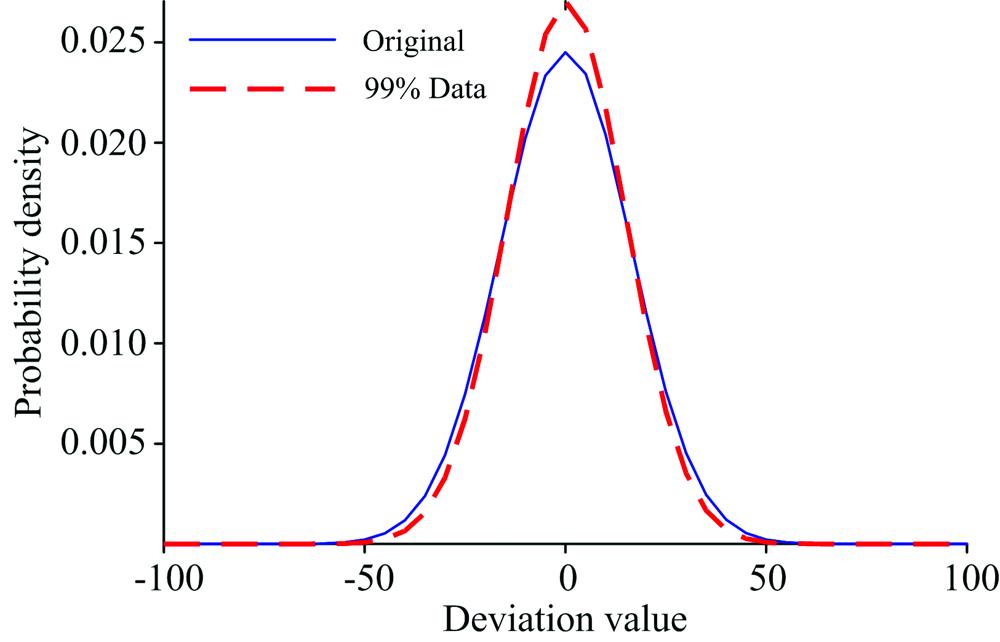
Fig. 1. The distribution with the original data and middle 99% data
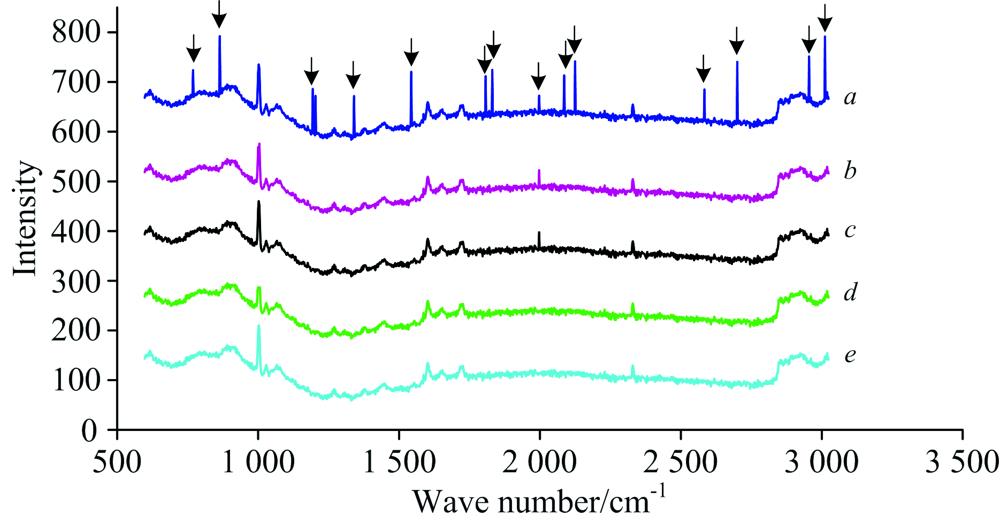
Fig. 2. Spike removal of 1-dimensional spectra with different window size and threshold
a : Raw spectrum; b : Spike removal with window size 7, threshold 1×10⁻⁵; c : Spike removal with window size 3, threshold 1×10⁻⁵; d : Spike removal with window size 7, threshold 1×10⁻³; e : Spike removal with window size 3, threshold 1×10⁻³. Arbitrary offsets were applied on the spectra for better visualization
Fig. 3. 1-dimensional Raman spectra spike removal process
a : Raw Raman spectrum; b : Raman Spectrum after 1-dimensional spike removal. Arbitrary offsets were applied on the spectra for better visualization
Fig. 4. 1-dimensional spectrum with artificial spikes
(a): Raman spectrum after spike removal; (b): Raman spectrum with 0.1 times artificial spikes;(c): Raman spectrum with 0.2 times artificial spikes; (d): Raman spectrum with 0.3 times artificial spikes; (e): Raman spectrum with 0.4 times artificial spikes; (f): Raman spectrum with 0.5 times artificial spikes
(a): Raman spectrum after spike removal; (b): Raman spectrum with 0.1 times artificial spikes;(c): Raman spectrum with 0.2 times artificial spikes; (d): Raman spectrum with 0.3 times artificial spikes; (e): Raman spectrum with 0.4 times artificial spikes; (f): Raman spectrum with 0.5 times artificial spikes
Fig. 5. 2-dimensional Raman image spike removal process
(a): Raw Raman image; (b): Raman image after 2-dimensional spike removal
(a): Raw Raman image; (b): Raman image after 2-dimensional spike removal
Fig. 6. 3-dimensional Raman data cube spike removal process
(a): Raw Raman data cube; (b): Raman data cube after 3-dimensional spike removal
(a): Raw Raman data cube; (b): Raman data cube after 3-dimensional spike removal
|
Table 1. Flowchart of algorithm
|
Table 2. 1-dimensional Raman spectra spike detection
|
Table 3. 2-dimensional Raman image spike detection
|
Table 4. 3-dimensional Raman data cube spike detection


Set citation alerts for the article
Please enter your email address

© Copyright 2018-2021 | Chinese Laser Press. All Rights Reserved 沪ICP备15018463号-20