
Yibo Hu, Lixin Meng, Yangyang Bai, Lizhong Zhang, Xing Jiang, Guohe Zheng, Zhi Liu. Coarse Tracking Equivalent Compound Control Technology for Space Laser Communication[J]. Laser & Optoelectronics Progress, 2023, 60(9): 0906004
- Laser & Optoelectronics Progress
- Vol. 60, Issue 9, 0906004 (2023)
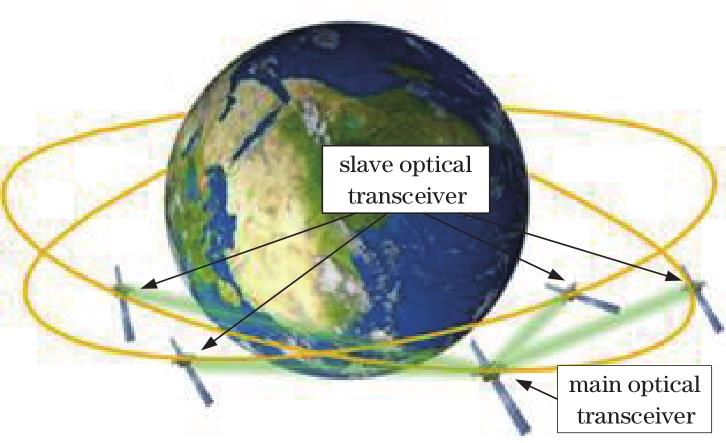
Fig. 1. Schematic diagram of one-to-four networking of space laser communication
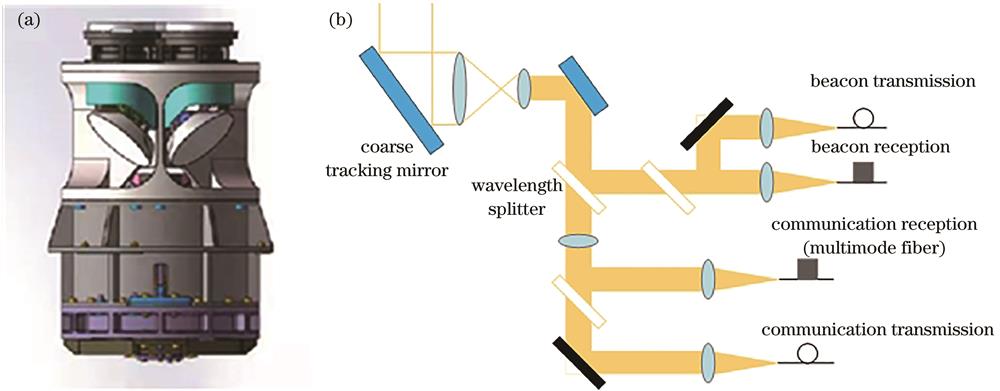
Fig. 2. Schematic diagram of main optical transceiver and its optical system. (a) Outline drawing of main optical transceiver; (b) schematic diagram of optical system (single path)
Fig. 3. Layout diagram of one-to-four networking of space laser communication
Fig. 4. Dynamic modeling analysis. (a) Schematic diagram of one-to-one experiment of space laser communication; (b) diagram of angular velocity and angular acceleration change
Fig. 5. Amplitude-frequency characteristic curve of speed loop
Fig. 6. Amplitude-frequency characteristic curve of position loop
Fig. 7. Block diagram of tracking system model
Fig. 8. Influence diagram of speed lag compensation parameters. (a) Tracking error; (b) phase margin; (c) overshoot
Fig. 9. Influence diagram of acceleration lag compensation parameters. (a) Tracking error; (b) phase margin; (c) overshoot
Fig. 10. Equivalent sine steady state tracking error curve
Fig. 11. Equivalent motion attitude tracking error curve
Fig. 12. Equivalent disturbance tracking error curve
Fig. 13. Coarse tracking experiment of main optical transceiver in networking
Fig. 14. Tracking error curve of disturbance experimental test
Fig. 15. Tracking error curve of motion attitude experimental test
|
Table 1. Wavelengths for communication between main and slave optical transceivers
| |||||||||||||||||||
Table 2. Sensitivity analysis of velocity and acceleration parameters
|
Table 3. Tracking error results of simulation experiment
|
Table 4. Tracking error results of actual experiment

Set citation alerts for the article
Please enter your email address
© Copyright 2018-2021 | Chinese Laser Press. All Rights Reserved 沪ICP备15018463号-20