
Chengming ZHANG, Shixiu WENG, Jigang BAO. The changes in the geographical patterns of China’s tourism in 1978-2018: Characteristics and underlying factors[J]. Journal of Geographical Sciences, 2020, 30(3): 487
- Journal of Geographical Sciences
- Vol. 30, Issue 3, 487 (2020)
Abstract
Keywords
1 Introduction
In the past 40 years of reform and opening-up, China’s tourism industry has shifted from solely focusing on inbound tourism to developing both inbound tourism and domestic tourism, and further to concurrently developing domestic tourism, inbound tourism and outbound tourism. According to statistics, the number of inbound tourists was 139 million in 2017, which was 77 times that of 1978; the number of domestic tourists was 5 billion, which was 14.5 times that of 1991. The outbound tourists reached 129 million, and the outbound tourism consumption reached $115.29 billion in 2017. China will not only become the world’s largest tourist country and the fourth most significant source of tourists by 2020 (
Spatiotemporal pattern of China’s tourism is a traditional research topic, and studies on this topic have achieved fruitful results. On the spatial scale, these studies could be divided into the regional-scale and national-scale. Regional-scale studies would regularly apply several kinds of tourism data (e.g. inbound tourist, tourism foreign exchange, domestic tourist or domestic tourism income) to analyze the tourism spatiotemporal pattern of one urban agglomeration (
Given that tourism is a complex economic phenomenon and it is difficult to fully reflect the real situation of tourism development by using a single index (
For the reasons above, based on the data of inbound tourists for the period 1979-2017 and the data of domestic tourists for 1991-2017, this article attempts to sort out the characteristics and causes of China’s tourism geographical pattern in the past 40 years from a national-scale perspective. The Gini coefficient, primacy index analysis and hot spot analysis are employed to map China’s tourism geographical pattern, and Pearson correlation analysis is utilized to analyze the influencing factors of China’s tourism development. Standing at the critical historic node of the 40 years of reform and opening-up, this article aims to make an academic supplement to the study of geographical pattern in China’s tourism, and it also provides a useful summary and guidance for the development of tourism industry in China.
2 Data sources and methods
2.1 Data sources
This study mainly analyzes the data of inbound tourists for the period from 1979 to 2017 and the data of domestic tourists for the period from 1991 to 2017. The provincial-scale data of inbound tourists and domestic tourists collected from the Yearbook of Tourism Statistics (1980-2018) and Statistical Yearbook (1980-2018) of every province in China. Besides, data of tourism foreign exchange, domestic tourism income, outbound tourists and outbound tourism consumption used in some sections also collected from the Yearbook of Tourism Statistics and Statistical Yearbook of every province. Among the data, provincial data do not contain data from Hong Kong, Macao and Taiwan. Because Hainan Province established in 1988, data of Hainan Province for the period 1979-1987 are not available. Besides, for convenience of expression, the inbound tourist in this article refers to inbound overnight tourist.
The national-scale data come from the China Statistical Yearbook. Among them, the national-scale data in 2017 collected from the Statistical Bulletin of National Economic and Social Development. Map data for Figures 1, 9 and 10 collected from the national primary geographic information database (scale 1:4 million). The data of specific variables in
![]()
Figure 1.Figure 1
| Factors | Variables | Domestic tourists | Inbound tourists |
|---|---|---|---|
| Economic level | GDP | 0.996** | 0.809** |
| Consumption level | Per capita GDP | 0.995** | 0.815** |
| Total retail sales of social commodities | 0.998** | 0.769** | |
| Industrial development | Third industry proportion | 0.922** | 0.880** |
| Third industry output value | 0.998** | 0.775** | |
| Investment status | Investment in fixed assets | 0.996** | 0.738** |
| Traffic conditions | Railway mileage | 0.991** | 0.810** |
| Road mileage | 0.909** | 0.928** | |
| Civil aviation domestic routes | 0.985** | 0.752** | |
| Civil aviation international routes | 0.967* | 0.783** | |
| Civilian passenger vehicle | 0.994** | 0.722** | |
| Accommodation services | Number of rooms in star hotels | 0.754** | 0.984** |
| Intermediary services | Travel agency scale | 0.918** | 0.959** |
| Degree of openness | Use of foreign capital | 0.515** | 0.817** |
| Import and export volume | 0.938** | 0.903** |
Table 1.
Correlation analysis of factors influencing tourism at national scale in China
| Factors | Variables | Domestic tourists | Inbound tourists |
|---|---|---|---|
| Tourist attractions | Scenic spots | 0.621** | 0.573** |
| High-grade scenic spots | 0.721** | 0.201 | |
| Economic level | Provincial GDP | 0.693** | 0.594** |
| Consumption level | Per capita GDP | 0.080 | 0.232 |
| Industrial development | Tertiary industry income | 0.627** | 0.637** |
| Investment status | Investment in fixed assets | 0.832** | 0.263 |
| Accommodation services | Number of accommodations | 0.650** | 0.730** |
| Number of restaurants | 0.676** | 0.635** | |
| Intermediary services | Total number of travel agents | 0.637** | 0.461** |
| Traffic conditions | Number of private cars | 0.707** | 0.507** |
| Railway passenger volume | 0.650** | 0.645** | |
| Highway passenger volume | 0.638** | 0.321 | |
| Civil aviation passenger volume | 0.136 | 0.808** | |
| Degree of openness | Use of foreign capital | 0.516** | 0.529** |
| Import and export volume | 0.279 | 0.871** |
Table 2.
Correlation analysis of factors influencing tourism at provincial-scale in China
2.2 Methods
2.2.1 Gini coefficient
Gini coefficient is a universal index to measure economic inequality in the world. This study uses it to measure the degree of imbalance in China’s tourism geographical pattern. The mean difference method is often applied to calculate the Gini coefficient with discrete data (
where n is the total number of areas, μy is the average income of all areas, yi and yj are the income of area i and j. In this study, n is the number of provincial administrative units, μy is the average of inbound tourists in all provinces, yi and yj are the number of inbound tourists in province i and j, respectively. With this formula, the Gini coefficient of inbound tourists is calculated. Similarly, the Gini coefficient of domestic tourists is also calculated. According to the United Nations Development Program, if the Gini coefficient exceeds 0.4, there is a serious “gap between the wealthy and the poor” (
2.2.2 Hot spot analysis
Hot spot analysis can calculate Getis-Ord Gi* statistics for attribute values of elements, and Z-score and p-value can know the location of high-value or low-value elements in spatial clustering. Gi* is calculated as formula (2), where xj is the attribute value of factor j, Wi, j is the spatial weight of elements i and j, and n is the total number of elements (
The specific calling path in the ArcGIS 10.1 platform is Arctoolbox-Spatial Statistics Analysis-Mapping Cluster-Hot Spot Analysis. In the visualization of results, Natural Breaks is used. This classification method can classify the similarity values most appropriately and maximize the differences among different classes. Moreover, the Gi* were classified into three tiers by using Natural Breaks in this article. The first tier stands for the highest Gi* score, that is to say, the provinces of the first tier have the highest tourist number. Likewise, the provinces of the second tier and the third tier stand for the higher tourist number and the lowest tourist number, respectively.
2.2.3 Primacy analysis
In 1939, American scholar Jefferson put forward the concept of “primate city” and defined the ratio of the largest city to the second largest city in population as the primacy index. According to experience, a reasonable primacy index should be 2. If 2 > primacy index >1, it indicates that the primacy distribution is not significant; if 4 ≥ primacy index > 2, the primacy distribution is moderate; if primacy index > 4, the primacy distribution is high (
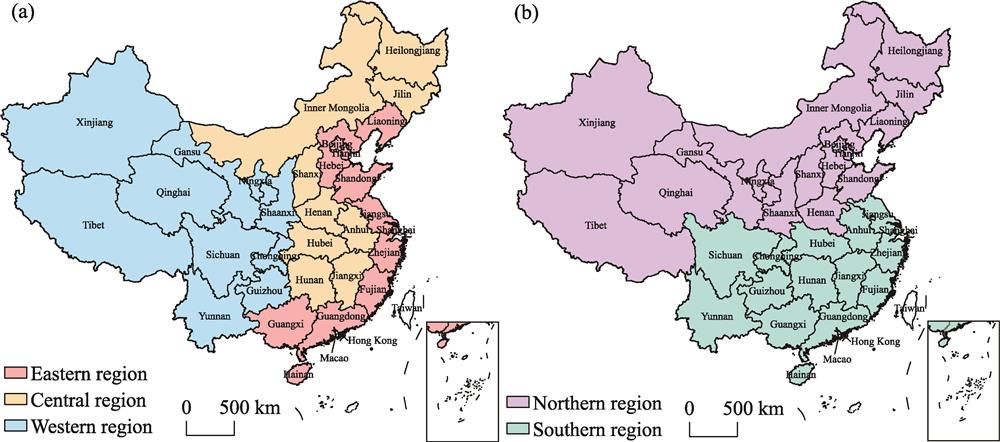
2.2.4 The division of spatial regions in China
According to the criteria for the division of China’s economic zones during the Seventh Five-Year Plan period, in the east-west direction, this study divides China into eastern, central and western regions. As shown in
In the south-north direction, this study divides China into southern and northern regions by the “Qinling Mountains-Huaihe River” line. As shown in
3 Overall characteristics
3.1 The geographical pattern of tourism is “high in the eastern and low in the western part; high in the southern and low in the northern part.”
3.1.1 High in the eastern and low in the western part
In terms of inbound tourists, as shown in
![]()
Figure 2.Figure 2
3.1.2 High in the southern and low in the northern part
From the perspective of inbound tourists, as shown in
![]()
Figure 3.Figure 3
3.2 Polarized distribution of inbound tourism
3.2.1 Inbound tourism presents a polarized distribution
By calculating the Gini coefficient of inbound tourists and inbound tourism foreign exchange earnings, as shown in
![]()
Figure 4.Figure 4
3.2.2 Guangdong is the “polar core” of inbound tourism
Guangdong always ranks first in the inbound tourists. The provinces in the second place have changed over time. As shown in
![]()
Figure 5.Figure 5
3.3 Domestic tourism from polarized distribution to equilibrium distribution
3.3.1 The Gini coefficient of domestic tourism gradually decreases
As shown in
3.3.2 The primacy distribution of domestic tourists is not significant
For domestic tourists, the primate provinces in different periods have changed over time, and the primate provinces have changed from Beijing to Jiangsu, then to Shandong. The secondary provinces are different in different periods. As shown in
3.4 Differences of tourism development among different regions
3.4.1 The distribution of inbound tourists is quite different
Inbound tourism in eastern, western, southern and northern regions are in polarized distribution. As shown in
![]()
Figure 6.Figure 6
The primacy distribution of inbound tourists in different regions is different, and the primacy index is decreasing year by year. As shown in
![]()
Figure 7.Figure 7
3.4.2 Relatively balanced distribution of domestic tourists
Domestic tourists in the western and northern regions present a polarized distribution. As shown in
Primacy distribution of domestic tourists in all regions is not significant, and the primacy index is decreasing year by year. As shown in
3.5 Changes in tourism rankings
As shown in
| Province | IT/million | Province | TFE/$billion | Province | DT/million | Province | DTI/¥billion |
|---|---|---|---|---|---|---|---|
| Guangdong | 36.48 | Guangdong | 19.65 | Shandong | 763.74 | Jiangsu | 1130.75 |
| Shanghai | 8.73 | Zhejiang | 8.28 | Jiangsu | 742.87 | Guangdong | 1066.70 |
| Fujian | 6.92 | Fujian | 7.59 | Guizhou | 740.00 | Sichuan | 882.54 |
| Yunnan | 6.68 | Shanghai | 6.81 | Sichuan | 670.00 | Zhejiang | 871.72 |
| Zhejiang | 5.89 | Beijing | 5.12 | Henan | 662.04 | Shandong | 842.07 |
Table 3.
Top 5 provinces of IT, TFE, DT and DTI in 2017 in China
As shown in
| Inbound tourists | Tourism foreign exchange | Domestic tourists | Domestic tourism income | ||||
|---|---|---|---|---|---|---|---|
| Province | Growth ratio | Province | Growth ratio | Province | Growth ratio | Province | Growth ratio |
| Tianjin | 600% | Ningxia | 1396% | Xizang | 1060% | Xizang | 1697% |
| Tibet | 405% | Xinjiang | 676% | Gansu | 863% | Jiangxi | 1088% |
| Sichuan | 381% | Sichuan | 574% | Guizhou | 808% | Gansu | 1057% |
| Hunan | 354% | Xizang | 536% | Jiangxi | 614% | Hebei | 1037% |
| Ningxia | 353% | Anhui | 431% | Anhui | 530% | Yunnan | 1024% |
Table 4.
Top 5 provinces of growth ratio of IT, TFE, DT and DTI from 2008 to 2017 in China
4 Characteristics in different stages
According to the characteristics of China’s tourism development in different times, as shown in
![]()
Figure 8.Figure 8
4.1 The initial modern tourism stage: from 1978 to 1988
The year of 1978 is the start of China’s modern tourism. In March of the year, the central government of China reorganized the Administration of China’s Traveling and Tourism into the China National Tourism Administration (CNTA) that was under the charge of the Ministry of Foreign Affairs. At the same time, all provinces (including autonomous regions and municipalities) were required to set up tourism bureaus. In October of 1978, Deng Xiaoping pointed out that “the two industries of civil aviation and tourism are very worthwhile to do”, “civil aviation and tourism should be managed by means of economic management, and profits shall be made from these two industries” The attribute of Chinese tourism has changed from “foreign affairs reception” to “an important industry” (
The characteristics of tourism geographical pattern in this stage are as follows: inbound tourism was severely polarized, and Guangdong played an essential role in this polarized pattern. In this stage, the Gini coefficient of inbound tourists is above 0.75, indicating a severely polarized distribution. In addition, hot spot analysis on clustering of provinces found that all high-level provinces are located in the southeastern coastal area of China. Guangdong is the only province in the first tier. In this stage, the second tier included at least four provinces, as shown in
![]()
Figure 9.Figure 9
4.2 The domestic tourism cultivating stage: from 1989 to 1996
The “political disturbance” in 1989 caused a heavy blow to China’s inbound tourism. The inbound tourists dropped by 23%, and China’s tourism development entered a new stage in 1989. At the beginning of the 1990s, expanding domestic demand became a vital direction for national economic development. Therefore, as a necessary means of expanding domestic demand, domestic tourism became an indispensable part of China’s tourism. In 1991, the provinces gradually added domestic tourism statistics into their yearly statistics. Before that, due to the emphasis on inbound tourism, official domestic tourism statistics were rarely found. In 1993, the State Council of China circulated the Opinions on Actively Developing Domestic Tourism issued by the CNTA and put forward the guidelines of “invigorating the market, leading correctly, strengthening management and improving quality” for domestic tourism. In the same year, the CNTA commissioned the National Bureau of Statistics to conduct a sample survey on the domestic tourism situation of urban residents every year, from then on domestic tourism began to be formally included in the regular statistics. In 1995, the system of “two-day weekend” began to implement. As a consequence, the leisure time for residents increased, and the domestic tourism market prospered further. The domestic tourists grew from 340 million in 1991 to 640 million in 1996. At the same time, inbound tourists increased steadily from 24.514 million in 1989 to 51.127 million in 1996.
In this stage, the characteristics of tourism geographical pattern are as follows: the spatial structure of inbound tourism remains unchanged, and Fujian developed rapidly in inbound tourism. Hot spot analysis on clustering of provinces revealed that Guangdong was still the only province in the first tier, the second tier included six provinces at most, as shown in
Furthermore, domestic tourism presented a pattern of polarization, and Beijing took first place in domestic tourism. In this stage, the Gini coefficient of domestic tourists was on the high side, above 0.4, indicating that the distribution was polarized nationwide. Through the hot spot analysis, this article found that there was no “polar core” for domestic tourists, with Beijing and Shanghai taking the first place and the second place in domestic tourists, respectively. The first tier included two provinces at least, as shown in
![]()
Figure 10.Figure 10
4.3 The rapid development stage: from 1997 to 2007
In 1997, the Asian financial crisis caused a severe blow to the economies of Asian countries, including China. However, the tourism industry in China was not affected much and grew steadily rather than fell. From this point, China’s tourism industry had entered the rapid development stage. The return of Hong Kong in 1997 and the return of Macao in 1999 had broadened the entrance to China’s inbound tourism and opened up essential exits for outbound tourism. The establishment of the “Golden Week” system in 1999 added a catalyzer to domestic tourism. In 1999, online travel agency represented by Ctrip was set up to provide service support for self-help traveling in China. In 2000, the per capita GDP of China exceeded $1000, and domestic tourism began to grow amazingly fast. China’s entry into the World Trade Organization in 2001 accelerated the reform of the domestic economic system and promoted standardization of tourism services and competition of the tourism market objectively. In this stage, the domestic tourists increased from 644 million in 2001 to 1.61 billion in 2007, the inbound tourists increased from 57.5879 million to 132 million, and the outbound tourists increased from 5 million to 40.954 million.
The characteristics of tourism geographical pattern in this stage are as follows: Shanghai gradually replaced the status of Beijing’s inbound tourism. By the hot spot analysis, this article found that only Guangdong was in the first tier; the second tier had at least four provinces, as shown in
The distribution of domestic tourism was relatively balanced in the gross, and the upper tier provinces mainly located in southeastern China. In this stage, the Gini coefficient of domestic tourists at the national-scale dropped to below 0.4, indicating a gradually balanced distribution throughout the country. By the hot spot analysis, this article found that the provinces of the first and second tiers are mainly located in the southeast of China, and the northwest regions were in the third tier. At the first tier, there were at most 11 provinces, as shown in
4.4 The new normal stage: from 2008 to present
Influenced by the American financial crisis, the global economy shrank in 2008. China’s tourism industry was also affected, and inbound tourism continued to decline in 2008 and 2009. Although impacted by the financial crisis, the domestic tourism of China increased by 6.3% compared with that in 2007, and it showed a strong anti-interference capability. In addition, with the opportunity of hosting the Beijing Olympic Games, the Shanghai World Expo and the Guangzhou Asian Games, China showed the world a new look and attracted about 130 million inbound tourists that got the highest level in history. Since then, China’s tourism development had entered the new normal stage. In 2008, China’s per capita GDP exceeded $3000, and outbound travel demand was strong. In the same year, Chinese outbound tourists became the focus of media in various countries. Because of their strong purchasing power, Chinese tourists became a source market competed by many countries. In 2013, with the per capita GDP exceeding $7000, China became the country with the highest outbound tourism consumption. The “Eight Provisions” promulgated in 2012 and the Notice on Prohibiting Party and Government Organs from Meeting in Scenic Spots issued in 2014 curbed “public-funded tourism” and hit the “luxury” of tourism consumption to a great extent. Although domestic tourism maintained rapid growth, the way tourists consume gradually shifted to budgeted consumption (
In this stage, the geographical pattern of tourism featured as the improvement of the spatial structure of inbound tourism and the inbound tourist entering the era of million person-times. Statistics showed that more than half of the provinces in this stage had crossed the threshold of 1 million inbound tourists, and the total number of inbound tourists had almost exceeded 130 million in China. After the hot spot analysis, it indicated that the second tier included 8 provinces at least, as shown in
The first tier provinces of domestic tourism increased significantly, and the third tier provinces were relatively fixed. After the hot spot analysis, it found that the first tier included at least 6 provinces, as shown in
Outbound tourism grew steadily. Beijing and Shanghai led outbound tourism consumption. During this period, the outbound tourists reached 45.84 million in 2008 and 129 million in 2017, which was 2.8 times that of 2008, with an average growth rate of 12.18%. Outbound tourism consumption reached $29 billion in 2008, peaking at $128.7 billion in 2013, and $115.29 billion in 2017. Since 2013, the outbound tourism consumption of China has ranked first in the world, with an average growth rate of 16.57%. In 2017, Beijing, Shanghai, Suzhou, Wenzhou, Shenyang, Changchun, Dalian, Qingdao, Guiyang and Jinan were among the top ten cities in terms of per capita consumption. Beijing has the highest amount of per capita outbound tourism consumption, averaged at 6817 yuan (RMB), equivalent to about $1000 (
5 Influencing factors
5.1 Qualitative analysis
5.1.1 Policies
Based on the particular national conditions of China, policy support and guidance of the government play a vital role in the development of tourism in China. Before the reform and opening-up, tourism was mainly about foreign affairs reception, instead of a real industry. After the reform and opening-up, marked by Deng Xiaoping’s “five speeches on tourism,” China’s foreign tourism reception has formally transformed into a modern industry. As mentioned above, at the beginning of reform and opening-up (1978-1988), inbound tourism was mainly intended for foreign exchange earnings and still marked by “quota supply.” Subsequently, the government attached more importance to the tourism industry. In 1992, the Chinese central government pointed out that tourism was the principal industry in the tertiary industry. After that, tourism was listed as the first industry in the tertiary industry to actively develop new industries according to Advice on Ninth Five-Year Plan for Economic and Social Development and the Outline of Vision 2010. In 1998, the central economic work conference put forward tourism as a new growth point of the national economy. In 2009, the Opinions on Accelerating the Development of Tourism pointed out that tourism should be cultivated into a strategic pillar industry of the national economy and a more satisfactory modern service industry for the people. In short, China’s tourism industry has undergone a transformation from reception to a foreign exchange earning industry, and then to a strategic pillar industry.
5.1.2 Management system
In 1981, the tourism industry implemented a unified leadership and decentralized management system. Unified leadership is unified planning, policy, system, discipline and coordination; decentralized management means division of responsibility and hierarchical management under the premise of unified leadership. In 1984, the situation that non-tourism sectors were not allowed to run the tourism business was broken down, and the power of outreach and visa control was decentralized. All provinces, autonomous regions and municipalities directly under the central government had the power of outreach. In 1988, the principle of “regulating the market by the state and guiding the enterprises by the market” established. The tourism industry experienced shifts from administrative management to industry management and from direct management of enterprises to indirect management and regulation through the market. In 1994, the CNTA further delegated to the local authorities the power of examination and approval of travel agencies and the power of star-rating assessment of foreign-related tourism hotels. In 1998, the CNTA no longer retained the functions for administration of foreign exchange, tourism planning and tourism price. Tourism development is left to the market further. Entering the new era, the market began to play a fundamental role in the allocation of resources to a greater extent and in a broader range. Recently, the “fundamental role” of the market becomes the “decisive role” in allocating resources. In a word, the administration of China’s tourism shifted from relative centralization to relative decentralization and now to a stage of full marketization.
5.1.3 Tourism demand
Experience shows that the development of tourism in a country or region will usually shift from sightseeing tourism to vacation tourism and from domestic tourism to international tourism (
5.2 Quantitative analysis
5.2.1 Factors affecting tourism at national-scale
This study used SPSS 22.0 to test the Pearson correlation coefficients between domestic and inbound tourists and other macro-data at the national-scale from 1991 to 2017. As shown in
For domestic tourism, the eight factors highly correlated with the number of domestic tourists. Except for the correlation coefficient between the number of guest rooms in star hotels and the number of domestic tourists, the correlation coefficients between the other 13 variables and the number of domestic tourists exceeded 0.9, showing a high correlation. For inbound tourism, the eight factors are strongly correlated with the number of inbound tourists. However, the correlation coefficients of the other 11 variables with the number of inbound tourists are less than 0.9 except for the four variables of “road mileage,” “number of rooms in star hotels,” “travel agency scale” and “import and export volume.” The four factors, i.e. traffic conditions, accommodation services, intermediary services and the degree of openness, have the greatest impact on inbound tourism.
5.2.2 Factors affecting tourism at provincial level
At the provincial level, as shown in
For domestic tourism, three variables, i.e. “per capita GDP,” “civil aviation passenger volume” and “import and export volume” of each province do not correlate with domestic tourist volume. The correlation coefficient between “high-grade scenic spots,” “investment in fixed asset,” “number of private cars” and domestic tourist volume is more than 0.7, which indicates that the three factors of the tourist attractions, investment status and traffic conditions highly correlate with domestic tourism. For inbound tourism, there is no correlation to “high-grade scenic spots,” “per capita GDP,” “investment in fixed asset” and “highway passenger volume.” The correlation coefficients between “number of accommodations,” “civil aviation passenger volume” and “import and export volume” exceeded 0.7, indicating that accommodation services, traffic conditions and degree of openness highly correlate with inbound tourism.
Of course, besides the factors mentioned above, the climate can also influence the length and fluctuation of the tourism seasonality (
6 Discussion
Both domestic tourism and inbound tourism show “high in the eastern and low in the western part; high in the southern and low in the northern part.” This characteristic is very similar to the finding by Li et al. They compared the overall efficiency of tourism of 2012 with that of 2013, and found that the overall efficiency of China’s tourism presented the pattern of “high in the eastern and low in the western part; high in the southern and low in the northern part” (
Tourism is a changing phenomenon with the development of itself; therefore, every development stage will present more or less different characteristics. This article summarized the history of China’s tourism in the past 40 years and divided it into four stages. In the initial modern tourism stage, the government’s attention was on inbound tourism; in the domestic tourism cultivating stage, domestic tourism could gradually develop; in the rapid development stage, the inbound and domestic tourism both developed dramatically, and by the new normal stage, the outbound tourism also stepped into the new era together with inbound and domestic tourism. Although these are just background for introducing the tourism geographical pattern in every stage, they can show some information to readers who want to understand the brief history of China’s tourism. It is noteworthy that the division of China’s tourism development in this article is different from the viewpoint of Xia and Xu’s. They divided it into three periods: the period of opening-up and preliminary reform (1978-1991), the period of the internal opening and accelerative reform (1992-2011) and the period of two-way opening and deepening reform (2012-present) (
This article mainly analyzed the spatial pattern of inbound tourist and domestic tourist and made some sense to China’s tourism. However, the provincial-level outbound tourist data are challenging to collect. Therefore, the limitation of this article is that the geographical pattern is only applicable to depict inbound and domestic tourism. In the future, adding the analysis of outbound tourist of every province to supplement this research is a desirable research direction. The other limitation is that we only analyzed the socio-economic factors, not the natural factors which could influence tourism development. In reality, tourism as an industry is undoubtedly affected by natural factors, such as air temperature, rainfall and altitude. Therefore, taking social, economic and natural factors into account to depict the integrated influence on tourism is the next research proposal.
7 Conclusions
This article simultaneously employed inbound tourist data and domestic tourist data to analyze the spatiotemporal pattern of China’s tourism from a national-scale perspective and 40-year time-scale perspective. The main contributions lie in using multiple tourism data and finding the overall features and stage characteristics for China’s tourism. The main conclusions are as follows:
In the past 40 years of reform and opening-up, the overall characteristics of China’s tourism geographical pattern are “high in the eastern, low in the western part; and high in the southern, low in the northern part.” Inbound tourism polarized for a long time, and Guangdong is the “polar core” of inbound tourism. Domestic tourism has experienced a process from polarized distribution to equilibrium distribution, and the primacy distribution of domestic tourists is not significant. In addition, the development of tourism differs significantly within eastern, central, western, southern and northern regions.
In the past 40 years, China’s tourism development could be divided into four stages, they are the initial modern tourism stage (1978-1988), the domestic tourism cultivating stage (1989-1996), the rapid development stage (1997-2007) and the new normal stage (2008-present), respectively. In the initial modern tourism stage, inbound tourism presented a severe polarization, and Guangdong played an essential role in forming that polarization. When it entered into the domestic tourism cultivating stage, inbound tourism spatial structure remained unchanged (Guangdong the first, Beijing the second, Shanghai the third), and the domestic tourism featured a polarized distribution by and large. When it stepped into the rapid development stage, the status of inbound tourism in Beijing was gradually replaced by Shanghai, and the distribution of domestic tourism balanced in principle. By the new normal stage, the spatial structure of inbound tourism significantly improved, and the number of provinces in the first tier of domestic tourism increased a lot. Likewise, outbound tourism increased rapidly in the new normal stage, and Beijing and Shanghai led the per capita consumption of outbound tourism.
The factors that affect the tourism geographical pattern in China are diverse. From the perspective of qualitative analysis, policies, management system and tourism demand affect the development of tourism in China. From the perspective of quantitative analysis, tourist attractions, economic level, consumption level, industrial development, investment status, traffic conditions, accommodation services, intermediary services and the degree of openness have different degrees of impact on domestic tourism and inbound tourism.
References
[2] J G Bao. From idealism to realism to rational idealism: Reflection on 30 years of development in tourism geography in China. Acta Geographica Sinica, 64, 1184-1192(2009).
[3] J G Bao. Budgeted consumption and China’s tourism development. Tourism Tribune, 30, 1-3(2015).
[6] Y C Chen, J Guo, H Xu. Leisure tourism: Research status, difference and connotation exploration. Geography and Geo-information Science, 30, 94-98(2014).
[8] Y L Du. Understanding Deng Xiaoping’s strategic thinking on tourism. Literature of Chinese Communist Party, 57-61(2012).
[9] Y R Guo, J Zhang, S J Lu et al. Spatio-temporal change of the inbound tourism economic development in China. Scientia Geographica Sinica, 34, 1299-1304(2014).
[10] B Q He, X J Hong. A review of research on calculation and decomposition methods of Gini coefficient. Statistics & Decision, 13-17(2016).
[11] Y F Huang, Y F Ma, H J Xue. Spatio-temporal-situational evolution and regional influencing factors of the inbound tourism service quality in China. Acta Geographica Sinica, 68, 1689-1701(2013).
[12] Z M Lei, J J Kang. Evaluation theory of urban primacy: Theoretical framework and empirical analysis. Urban Studies, 17, 33-38(2010).
[14] Z F Li, Y D Ye, J N Gao. Efficiency evaluation and agglomeration characteristics analysis of tourism industry in China. Statistics & Decision, 139-141(2017).
[15] Z J Li, W H Guan, Y X Pu et al. Exploration on the tourism economy spatio-temporal pattern in Shandong province. Economic Geography, 33, 176-181(2013).
[16] F J Liu, J Zhang, D D Chen. The characteristics and dynamical factors of Chinese inbound tourist flow network. Acta Geographica Sinica, 65, 1013-1024(2010).
[17] J Liu, L Huang, L J Wu et al. Assessment on direct and virtual water consumption of rural tourism in back-mountain of Qingcheng. Tourism Tribune, 33, 108-116(2018).
[18] J Liu, Y Y Li, H L Liu et al. Climate change and peach blossom viewing: Impact and adaptation. Geographical Research, 35, 504-512(2016).
[20] R F Ma, X X Ni, W Z Zhang et al. A multi-scale research on tourism economic spatio-temporal difference in Zhejiang province. Economic Geography, 35, 176-182(2015).
[21] Y F Ma, Y J Li. Research on spatial region-division of inbound tourist flow in China. Human Geography, 16, 44-46(2001).
[22] C Y Shi, J Zhang, H M You et al. Core-periphery spatial structure and its evolution of tourism region in Sichuan province. Acta Geographica Sinica, 62, 631-639(2007).
[23] S Q Sun. Research on Tourism Economy in China, 1-2(1990).
[24] Z X Tao, Q S Ge, H J Wang et al. Phenological basis of determining tourism seasons for ornamental plants in central and eastern China. Journal of Geographical Sciences, 25, 1343-1356(2015).
[25] Tourism 2020 Vision. Madrid: World Tourism Organization(2001).
[26] D G Wang, Y Niu, J Qian. Evolution and optimization of China’s urban tourism spatial structure: A high speed rail perspective. Tourism Management, 64, 218-232(2018).
[27] H Q Wang, J D Yuan, X J Meng. Spatial distribution and its influencing factors of level-A scenic spots in northeast China. Scientia Geographica Sinica, 37, 897-903(2017).
[28] K Wang, J Yi, H Li. An analysis of the spatio-temporal disparities of inbound tourism development in China: 1991-2010. Human Geography, 129, 134-140(2014).
[29] Q Wang, J H Zhang, X Z Yang. Analysis of water ecology capacity in Huangshan resort. Geographical Research, 28, 1105-1114(2009).
[31] Q Wu, X G Li, L Wu et al. Distribution pattern and spatial correlation of A-grade tourist attractions in Hunan province. Economic Geography, 37, 193-200(2017).
[32] J C Xia, J H Xu. Reform and opening-up of tourism in China from 1978 to 2017: Retrospects and prospects. Research on Economics and Management, 39, 3-14(2018).
[33] Y Yang, K K Wong. Spatial distribution of tourist flows to China’s cities. Tourism Geographies, 15, 338-363(2013).
[34] C H Zhang, Y F Ma, J Wu et al. Coupling coordination degree between inbound tourist flows and destinations and its spatio-temporal differences in the western region of China: A study from the perspective of supply-demand relationship. Economic Geography, 33, 174-181(2013).


Set citation alerts for the article
Please enter your email address

© Copyright 2018-2021 | Chinese Laser Press. All Rights Reserved 沪ICP备15018463号-20