
Hongwei Li, Bo Zhao, Liwei Jin, Dongmei Wang, Wei Gao, "Flat gain over arbitrary orbital angular momentum modes in Brillouin amplification," Photonics Res. 7, 748 (2019)
- Photonics Research
- Vol. 7, Issue 7, 748 (2019)
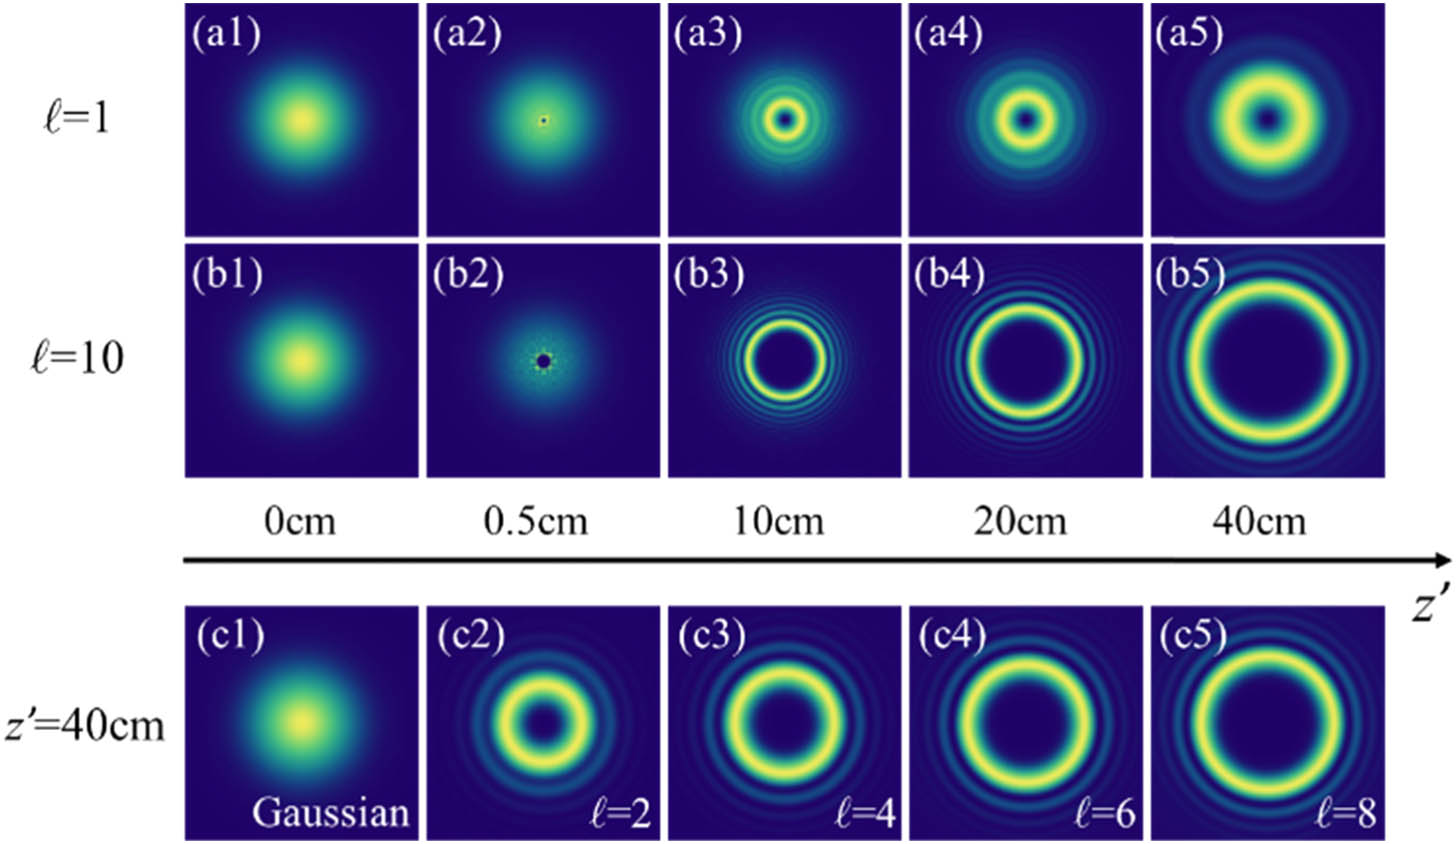
Fig. 1. Simulation results. The propagation evolution in free space of the vortex beam with l = 1 l = 10
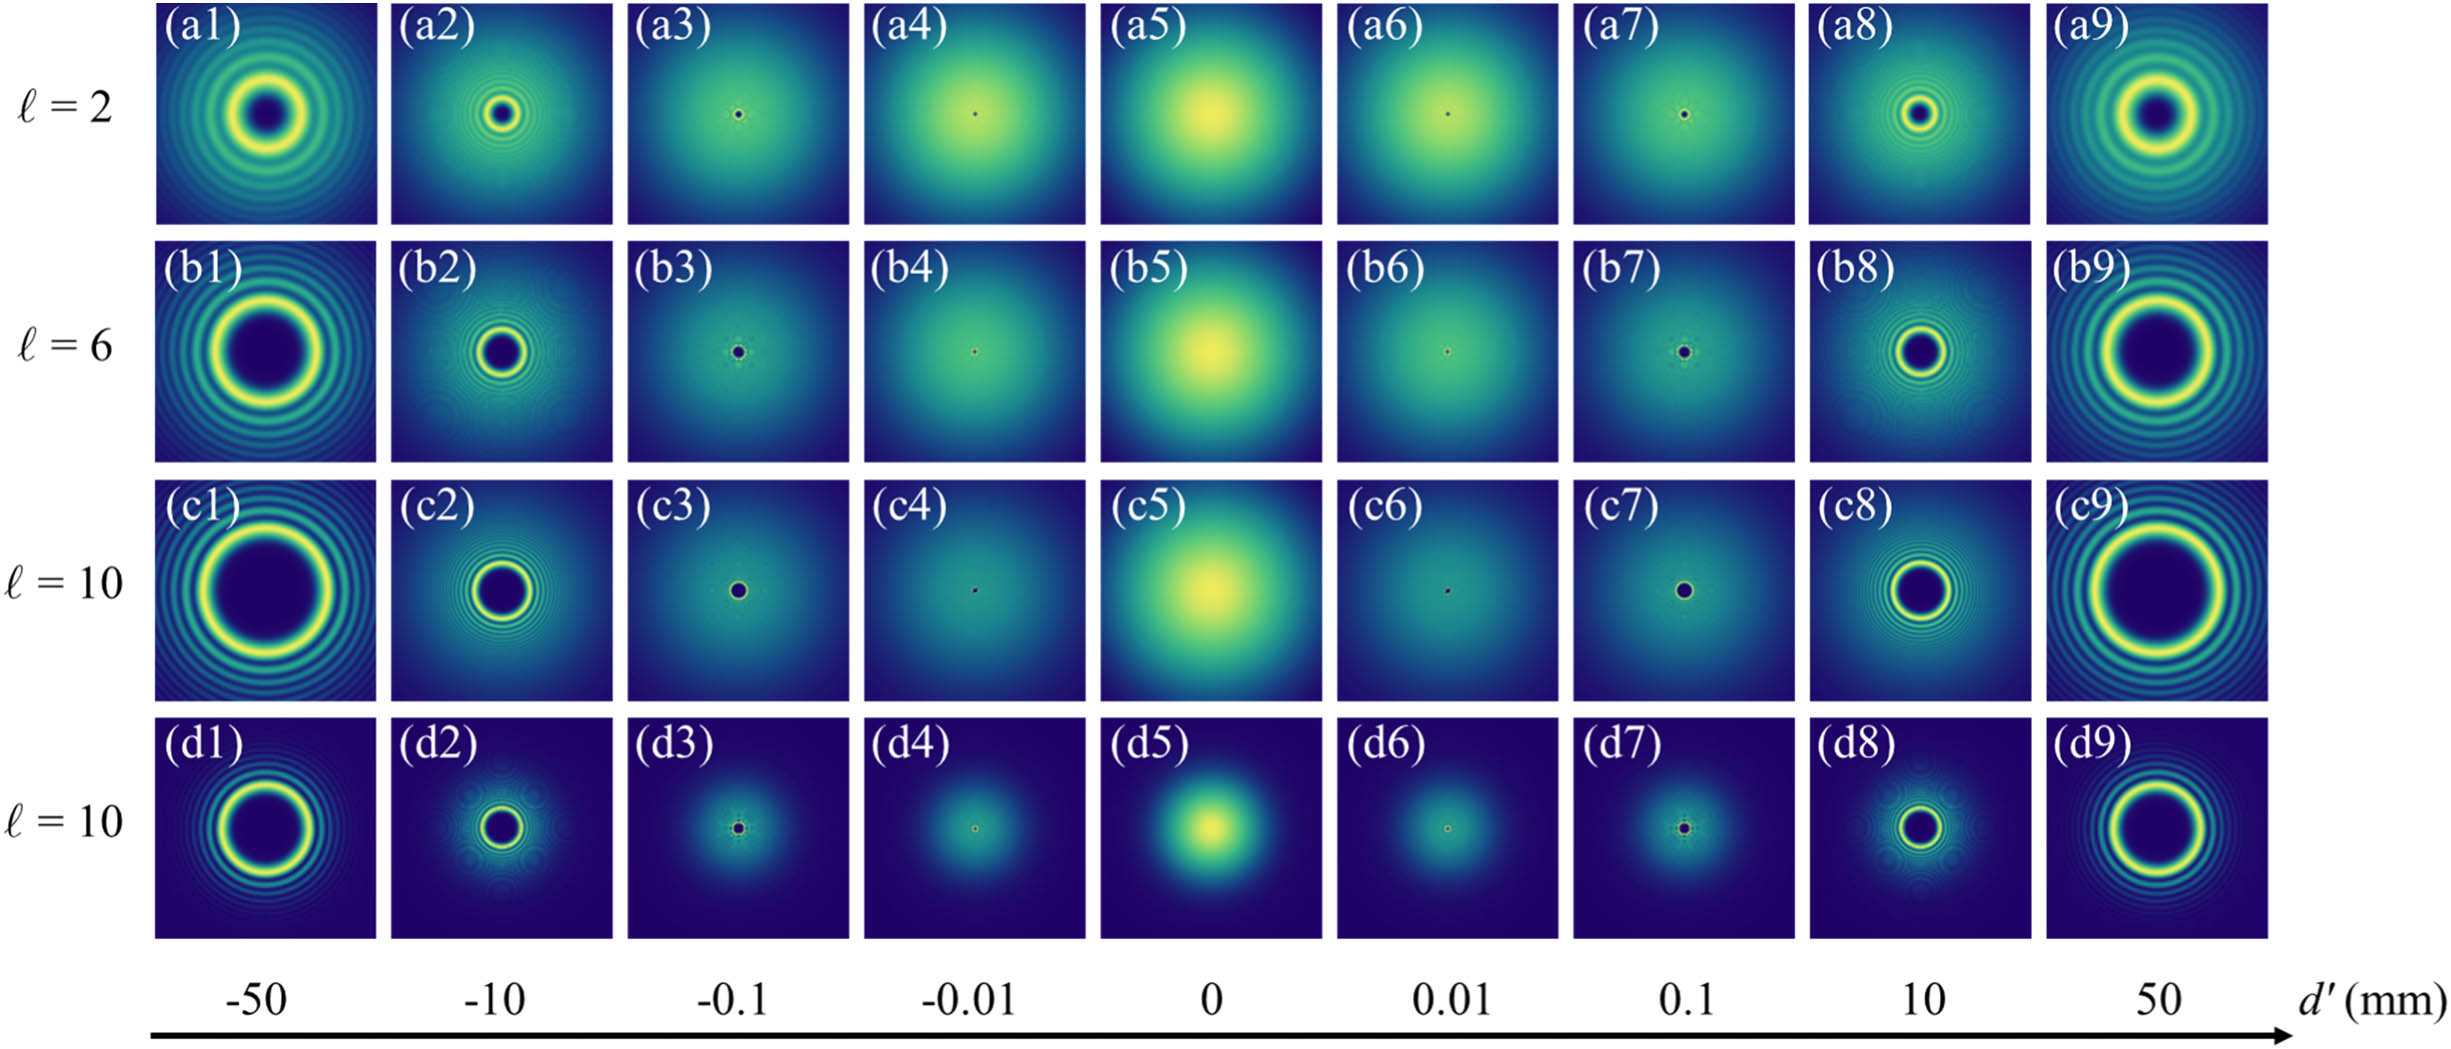
Fig. 2. Simulation results for the propagation behavior of Stokes beams with l = 2 f 1 = f 2 = 10 cm f 1 = 10 cm f 2 = 5 cm l = 10
Fig. 3. Experimental setup. HWP, half-wave plate; PBS1 and PBS2, polarized beam splitter; QWP1 and QWP2, quarter-wave plate; BA-cell, Brillouin amplifier cell; L1–L4, lens. (a) The intensity distribution of the wave source of the OAM mode. The intensity distribution of the OAM mode at the center of BA-cell (b) without and (c) with utilizing the 4f imaging system.
Fig. 4. Experimental results. (a) Amplified Gaussian-profile beam. (b1)–(b4) The intensity distribution of output OAM beams without the 4f imaging system. Utilizing the 4f imaging system, the intensity profiles of the amplified OAM beam at (c1)–(c4) the secondary image plane and (d1)–(d4) the propagating distance of 40 cm, where the orders are set to 2, 6, 8, and 10, respectively. (e) Simulation curves and experimental results of the mode gain versus its orders.
Fig. 5. Gain versus the pump energies for the OAM mode of l = 10


Set citation alerts for the article
Please enter your email address

© Copyright 2018-2021 | Chinese Laser Press. All Rights Reserved 沪ICP备15018463号-20