• Chinese Optics Letters
  • Vol. 20, Issue 10, 100003 (2022)
Xuanke Zeng1, Congying Wang1, Yi Cai1, Qinggang Lin1、2, Xiaowei Lu1、*, Jiahe Lin1, Xinming Yuan1, Wenhua Cao2, Yuexia Ai2, and Shixiang Xu1、**
Author Affiliations
  • 1Key Laboratory of Optoelectronic Devices and Systems of Ministry of Education and Guangdong Province, Shenzhen Key Laboratory of Micro-Nano Photonic Information Technology, College of Physics and Optoelectronic Engineering, , Shenzhen 518060, China
  • 2College of Electronics and Information Engineering, , Shenzhen 518060, China
  • show less
    DOI: 10.3788/COL202220.100003 Cite this Article Set citation alerts
    Xuanke Zeng, Congying Wang, Yi Cai, Qinggang Lin, Xiaowei Lu, Jiahe Lin, Xinming Yuan, Wenhua Cao, Yuexia Ai, Shixiang Xu. High spatial-resolution biological tissue imaging in the second near-infrared region via optical parametric amplification pumped by an ultrafast vortex pulse [Invited][J]. Chinese Optics Letters, 2022, 20(10): 100003 Copy Citation Text show less

    Abstract

    Applying an ultrafast vortex laser as the pump, optical parametric amplification can be used for spiral phase-contrast imaging with high gain, wide spatial bandwidth, and high imaging contrast. Our experiments show that this design has realized the 1064 nm spiral phase-contrast idler imaging of biological tissues (frog egg cells and onion epidermis) with a spatial resolution at several microns level and a superior imaging contrast to both the traditional bright- or dark-field imaging under a weak illumination of 7 nW/cm2. This work provides a powerful way for biological tissue imaging in the second near-infrared region.

    1. Introduction

    Biological imaging in the second near-infrared region (NIR-II, 1.0–1.7 µm) has been drawing considerable attention for many years due to its merits, including higher spatial resolution, deeper penetration depth, and lower optical absorption and scattering from biological tissues compared with those in the first near-infrared region (NIR-I, 650–950 nm) and visible regions[16]. As for the biological tissues, many of them, performing phase-only objects, are difficult to be observed or imaged accurately because only the phases, rather than the intensities, change when the light waves pass through the objects. Accordingly, bright-field imaging usually has too small contrasts to display accurately the details by imaging equipment or human eyes. Conventional phase-contrast (PC) methods[7] transform the phases into the intensity variations of the illumination signals, thus realizing the observations of phase samples. Nevertheless, the conventional PC has some shortcomings, e.g., the inevitable halo, fading phenomenon, and the limitation of the phase change to be much less than 2π, which limits its application. Differential interference PC method[8,9], another way to transform the phase gradient into intensity change of an object, is widely used in biological tissue observation. However, this method, based on polarization interference imaging, is not suitable for recording the birefringent samples due to the occurrence of artifacts. In recent decades, the emergence of optical vortices has provided another effective way for phase imaging because of their unique spiral phase characteristics[1012]. By using a 4-f imaging system with a spiral phase plate (SPP) on its Fourier plane, PC imaging can be implemented for both amplitude and phase objects[1316]. There, spiral phase filtering (SPF) presents an ideal isotropic effect on optical imaging for the detail-enhancement effect (DEE), thereby improving imaging contrast and having finer resolvable details.

    In recent years, some efforts have been made to combine PC imaging with some nonlinear optical processes, including second harmonic generation (SHG)[17], sum-frequency generation (SFG)[18,19], and non-collinear optical parametric amplification (OPA) in order to achieve the DEE, thereby getting high imaging contrast and sensitivity. Especially for OPA, with the development of ultrafast laser technology, the shorter available pulse duration allows us to have higher OPA pump intensity, thereby achieving high gain and wide spatial bandwidth, which makes OPA imaging available for weaker illumination or imaging sensitivity, as well as higher spatial resolution[20,21]. In this paper, we use an intense 532 nm picosecond pulse as the OPA pump for high-spatial-resolution biological tissue imaging in the NIR-II region based on non-collinear OPA. In order to achieve the DEE, the pump has been modulated into a vortex laser pulse, while an OPA crystal is placed on the Fourier plane of a 4-f imaging system. All these arrangements aim to realize detail-enhancement imaging for biological tissues with high spatial resolution, high contrast, and high OPA gain in NIR-II region.

    2. Theory and Simulation

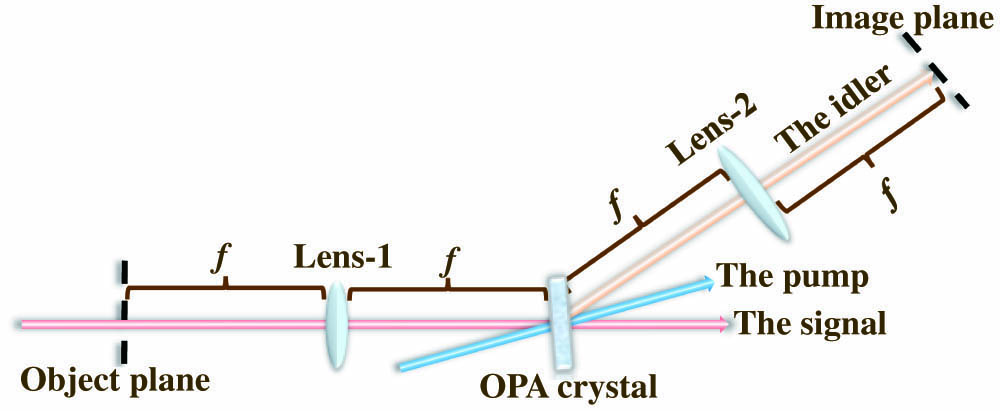
    In principle, our imaging system is illustrated by Fig. 1, where a 4-f imaging system is with an optical parametric amplifier at the Fourier plane. We can see the imaging path goes firstly along the signal and then along the idler instead after the amplifier. The amplifier is pumped by a vortex laser pulse, so both the signal and the idler are modulated by a spiral phase function during OPA. Supposing that the incident light field to the object is Es(r,ϕ), the light field at the Fourier plane Ef(ρ,φ)=[Es(r,ϕ)]·H(ρ,φ),where “·” and “” represent the dot product operation and the Fourier transform, while H(ρ,φ) is the equivalent modulation function of the ultrashort pulse-pumped OPA with [Ef(r,φ)] as the signal. Under the slowly varying amplitude approximation and the paraxial approximation, the generation of the idler can be described by the following equation[22]: Ei(ρ,φ,ωi)z=iωideffnic(cosβ)2Es(ρ,φ,ωs)Ep(ρ,φ,ωp)exp(iΔkz).

    Schematic of the spiral PC idler imaging system.

    Figure 1.Schematic of the spiral PC idler imaging system.

    Here, the subscripts “s,” “i,” and “p” stand for the signal, idler, and pump, corresponding to the optical frequency ωs, ωi, and ωp, respectively. c is the light velocity in vacuum, and z is the propagation distance. n and deff are the refractive index and the effective nonlinear coefficient, while β and Δk are the angle between the signal and the idler and the phase mismatch in three-wave coupling. Accordingly, the output idler image on the imaging plane shall be Ei(r,ϕ,ωi)Es(ρ,φ,ωs)*F[Ep(ρ,φ,ωp)].

    The symbol “*” stands for the convolution. Equation (3) shows that the output spiral PC idler imaging results from the convolution operation between the target (TA) and the pump. If the pump carries a vortex phase ilφ (l is the topological charge), it will impose a uniform edge-enhancement effect[23,24] on the idler image to have high contrast and excellent detail resolution for phase TAs.

    Figure 2 presents some numerical simulations for our spiral PC imaging system, as shown by Fig. 1 according to the subsequent experimental conditions. The pump is a 30 ps, 532 nm pulse with a pump intensity of 2GW/cm2. The OPA crystal is a 23.5°-cut, 3-mm-thick beta barium borate (β-BBO) crystal with a clear aperture of 8mm×8mm. The OPA occurs via three-wave interaction when the 1064 nm signal and the pump overlap spatially and temporally inside the β-BBO crystal by a non-collinear angle of 2°. Correspondingly, the 1064 nm idler image can be numerically simulated by solving the OPA coupled differential equations[25] through the split-step method[26]. The OPA gain has been estimated at 6.0, which increases with the pump intensity.

    Theoretical simulations: (a) the spiral PC idler image of a phase-only object, (b) the traditional spiral PC image (without OPA), the idler images (c) with a Gaussian laser pump and (d) with a vortex laser pump of a quasi-phase object.

    Figure 2.Theoretical simulations: (a) the spiral PC idler image of a phase-only object, (b) the traditional spiral PC image (without OPA), the idler images (c) with a Gaussian laser pump and (d) with a vortex laser pump of a quasi-phase object.

    In Fig. 2, we aim to simulate the spiral PC idler imaging with the design of Fig. 1, which is illuminated by a weak 1064 nm signal. The used TA is a phase-only or a quasi-phase object with a spatial profile as a USAF 1951 resolution testing pattern. The quasi-phase object means it adds a week amplitude-modulation to its incident light beam. For a phase-only object, our simulation shows the OPA imaging pumped with traditional Gaussian laser is unable to capture TA information. If the pump is replaced by a vortex pulse (l=1) as shown in Fig. 2(a), the idler image has presented clear information of the USAF 1951 pattern with excellent imaging contrast. As is known, the phase-only objects are very rare, and usually we may meet quasi-phase objects instead. Accordingly, from Figs. 2(b) to 2(c), a quasi-phase object is used as a substitute for the phase-only object with an amplitude modulation of 20% to the incident signal. For comparison, Fig. 2(b) shows its spiral PC image (without OPA), where the DEE is visible but with a very dark field. Figures 2(c) and 2(d) present the amplified idler image under the Gaussian beam pump and vortex pulse (l=1) pump, respectively. It seems that both images can clearly distinguish the lines of Group 4.5 with a spatial feature of 25.39 lp/mm (39.4 µm). However, due to the absence of SPF, the image of Fig. 2(c) has a low imaging contrast, which is defined as C=(ImaxImin)/(Imax+Imin)[17,27]. The local C value of Group 4.5 marked with the white arrow is about 14.8%. In contrast, the corresponding C value is up to 86.6% in Fig. 2(d), where, due to SPF, the idler image has clear features with bright details but dark background. From Figs. 2(b) to 2(d), we find that the vortex pump successfully combines SPF with OPA, which helps the system to realize spiral PC idler imaging with high gain and high contrast. All these simulations indicate that, by means of ultrashort vortex pulse laser pump, OPA idler imaging is well suitable for the phase TAs, e.g., biological tissues.

    3. Experimental Setup

    Figure 3 shows the setup of the spiral PC idler imaging based on non-collinear OPA. The used light source is a commercial 10 Hz, 30 ps mode-locked neodymium-doped yttrium aluminum garnet (Nd:YAG) laser, which can simultaneously output two fundamental-mode Gaussian (TEM00) beams with energy of 14 mJ at 1064 nm and 9 mJ at 532 nm. The 1064 nm beam with a diameter of 6 mm (1/e2 intensity) passes through a wedge, so about 1% of its power is reflected. In order to avoid the damage of the sample, the beam is attenuated to 20 nJ by a variable optical attenuator (VOA) to illuminate the TA object with an intensity of 0.7nJ/cm2 (an average power density of 7nW/cm2). After the TA is placed on the object plane, we use a microscope (MS) and a collimating lens (L1) for MS imaging. Next to L1, there is a 4-f imaging system consisting of a pair of confocal lenses (L2 and L3). The focal lengths of L1, L2, and L3 are 100, 150, and 150 mm, respectively. A 23.5°-cut, 2-mm-thick β-BBO crystal (NC), working for OPA, is set on the Fourier plane of the 4-f system. The 532 nm beam, the OPA pump, is guided into the β-BBO crystal by a dichroic mirror (DM) after a time delay line (TDL) and an SPP. Meanwhile, the signal after passing through TA and an MS (40×, NA=0.65, Olympus, RMS40X) is focused on the Fourier plane too. The TDL is used for the time synchronization between the signal and the pump, while the SPP works to modulate the pump into a vortex beam. Lenses L4 and L5 are used to image the SPP on the NC. The pump and the signal overlap with each other by a small intersection angle (2°) inside a β-BBO crystal, a nonlinear crystal for non-collinear OPA. The idler occurs at 1064 nm and goes with a non-collinear angle from both the pump and the signal under the phase-matching condition. The idler image is recorded on the imaging plane with a CCD camera (Basler, Aca-1600 gm) after L3. From the above description, we can see that in this imaging system, the weak illumination is amplified and phase-filtered by a vortex pump.

    Setup of the spiral PC idler imaging. VOA, variable optical attenuator; M, mirror; TA, target; MS, microscope; L1–L5, optical lenses; DM, dichroic mirror; TDL, time delay line; SPP, spiral phase plate; NC, OPA crystal; CCD, CCD camera.

    Figure 3.Setup of the spiral PC idler imaging. VOA, variable optical attenuator; M, mirror; TA, target; MS, microscope; L1–L5, optical lenses; DM, dichroic mirror; TDL, time delay line; SPP, spiral phase plate; NC, OPA crystal; CCD, CCD camera.

    4. Experimental Results and Discussions

    Firstly, a USAF 1951 pattern is used as a TA to calibrate the spatial resolution of our setup at absence of the MS and SPP. It is well known that the TA has many groups of spatial structures. Each group includes three parallel horizontal lines and three parallel vertical lines but corresponds to the same density. Figure 4(a1) is the idler image recorded via Gaussian-pumped OPA. It can display perfectly the three horizontal lines of Group 4.4 with a spatial feature of 22.62 lp/mm (44.2 µm), but only presents unclearly the three vertical lines. These phenomena can be well explained by Fig. 4(c1), where the one-dimensional (1D) intensity profile clearly shows three peaks across the three horizontal lines, but more than five (3) peaks across the three vertical lines. When an SPP is inserted into the pump path for SPF, the corresponding idler image has been recorded as Fig. 4(a2). Compared with Figs. 4(a1) and 4(a2), it shows that the bright zones move to the edges of the testing patterns, which results in obvious DEE. As a result, Fig. 4(a2) can resolve well the parallel lines of Group 4.5 along not only the horizontal but the vertical directions, which means the SPF helps to see the spatial features up to 25.39 lp/mm (39.4 µm). In Fig. 4(c2), the 1D profiles along both the horizontal and the vertical directions have six peaks, equal to double of the line number, which means that Group 4.5 is distinguishable due to DEE. Figures 4(b1) and 4(b2) are the idler images of a phase object, a piece of flat glass coated with UV curing adhesive, but Fig. 4(b1) is captured through Gaussian-beam-pumped OPA, while Fig. 4(b2) is by the vortex beam pump. As expected, Fig. 4(b2) can provide more details of the fine structures of the phase TA, so Fig. 4(b2) has much higher imaging contrast than Fig. 4(b1) due to high gain and effective DEE from vortex-pumped OPA. Obviously, Fig. 4 verifies experimentally that our spiral PC idler imaging system has very good spatial resolution and imaging contrast.

    Idler images: (a1) and (b1) with Gaussian pump, (a2) and (b2) with vortex pump, and (c1) and (c2) for the local 1D intensity profile of Group 4.4 marked with the white arrow in (a1) and (a2), respectively. Meanwhile, (a1) and (a2) for an intensity object (a USAF 1951 resolution testing pattern) and (b1) and (b2) for a phase object (a pattern formed by a piece of flat glass coated with UV curing adhesive).

    Figure 4.Idler images: (a1) and (b1) with Gaussian pump, (a2) and (b2) with vortex pump, and (c1) and (c2) for the local 1D intensity profile of Group 4.4 marked with the white arrow in (a1) and (a2), respectively. Meanwhile, (a1) and (a2) for an intensity object (a USAF 1951 resolution testing pattern) and (b1) and (b2) for a phase object (a pattern formed by a piece of flat glass coated with UV curing adhesive).

    To check the ability of our spiral PC idler imaging system for microscopic imaging, an MS is used behind the TA to distinguish more elaborate structures with an estimated axial resolution at 2 µm. We still calibrate the spatial resolution with the USAF 1951 pattern illuminated by a 1064 nm laser. Pumped with a Gaussian laser pulse (without SPF), from Fig. 5(a), we can see the parallel lines of Group 7.6 are well separated in the idler image, which is the highest density of our USAF 1951 pattern (228 lp/mm). If pumped with a vortex laser pulse, Fig. 5(b) can present the parallel lines more clearly with their bright and thin edges than Fig. 5(a) due to SPF or DEE. According to Fig. 5(b), it can be estimated that the idler PC image is able to resolve the TA details well beyond 228 lp/mm or 4.4 µm.

    Idler images of the USAF 1951 resolution testing pattern with a 40× MS: (a) Gaussian laser pump and (b) vortex laser pump.

    Figure 5.Idler images of the USAF 1951 resolution testing pattern with a 40× MS: (a) Gaussian laser pump and (b) vortex laser pump.

    Figure 6 shows our spiral PC idler imaging for some biological tissues with their thickness at about 0.1 mm. The tissues are sandwiched between a pair of fixed transparent glass plates with the dimensions of 7.6cm×2.5cm. The first TA is a frog egg cell sample, whose microscopic image is shown in Fig. 6(a1) (conventional MS imaging) with a 40× Olympus MS. Meanwhile, its OPA microscopic idler images with and without SPF (bright-field idler imaging and spiral PC imaging) are also presented in Figs. 6(a2) and 6(a3), respectively. By comparison, among them, we can find that the noisiest one is Fig. 6(a1), and then the next is Fig. 6(a2), so Fig. 6(c3) is the last, which is especially obvious in the sections within the white circles. For the fine structures (e.g., the long and thick ditches within the white square boxes), in Fig. 6(a1), we have a hard time seeing the details in the “black ditch,” where, in Fig. 6(a2), the details in the ditch are visible noisily, whereas Fig. 6(a3) can provide us with the clear features. It is noteworthy that, in Fig. 6(a1), some shallow streaks with a period of 4µm are visible over the whole picture, so we guess they result from some multi-reflections from some optical surfaces. However, these streaks disappear in both Figs. 6(a2) and 6(a3) due to the involvement of OPA. As we know, OPA only occurs when pumped, so the short pump duration can act as a rapid shutter to isolate the disturbances due to multi-reflection from the substrate surfaces.

    Microscopic images of frog egg cells and onion epidermis by (a1) and (b1) conventional MS imaging, (a2) and (b2) bright-field idler imaging, and (a3) and (b3) spiral PC idler imaging.

    Figure 6.Microscopic images of frog egg cells and onion epidermis by (a1) and (b1) conventional MS imaging, (a2) and (b2) bright-field idler imaging, and (a3) and (b3) spiral PC idler imaging.

    The used second sample is made of the onion epidermis. In order to avoid the disturbance from the multi-reflections, before the subsequent optical imaging, we record a microscopic image without anything at the imaged zone for calibration. Because the sizes of the glass plates are much larger than those of the biological tissues, the major zone of the gap between the fixed plate pair is filled with air, rather than the tissues. Each part of the plate pair is mounted on a translation stage when it is used. As a result, we can realize the calibration by aligning the translation stage so that the imaged zone is the air gap of the plate pair. The calibration finishes until the recorded optical field is so uniform that it is hard to see any fine structures, as shown in the right upper section (CI) of Fig. 6(b1). After this calibration, we move the translation stage so that the sample enters the imaged zone. Comparing this image with the calibration, we can distinguish the true TA structures from the artifacts. Similar to Figs. 6(a1)6(a3), we have recorded three images with the 40× MS: conventional MS imaging, bright-field idler imaging, and spiral PC idler imaging, as shown in Figs. 6(b1)6(b3), respectively. We check the three images by focusing on a small hole inside the white circles. In Fig. 6(b1) or 6(b2), the backgrounds are so strong that we fail to clearly see the holes. In contrast, Fig. 6(b3) presents the hole profile. By turning our attention to the information within the white square boxes, we can find some streaks there. However, the streaks have much higher visibility or contrast in Fig. 6(b3) than those in Figs. 6(b1) and 6(b2). The local C values are 24.9%, 14.3%, and 59.0% at the positions marked with the white arrows in Figs. 6(b1)6(b3), respectively. It is easy to see that the background suppression effectively improves the image contrast, so more object details can be recorded with our spiral PC idler imaging system with OPA. According to our estimation, the resolved details in Fig. 6(b3) can be as fine as 1.2 µm.

    From the experimental results and discussions above, we can conclude that our system can present better microscopic imaging than both conventional idler imaging and MS imaging. We attribute the advantage to its high OPA gain and SPF. The latter provides us with both DEE and dark background.

    5. Conclusions

    In short, we have presented spiral PC idler imaging for biological tissues in the NIR-II region. Our setup includes a 4-f optical system with an optical parametric amplifier on the Fourier plane. By using a vortex laser beam to pump the amplifier at an intensity of 2GW/cm2, idler imaging with SPF has been realized experimentally with an OPA gain of 6.0. The SPF, resulting from the vortex pump, allows us to actualize the idler imaging with dark background and bright detail features. The OPA gain together with the background suppression makes an effective improved imaging contrast. When using the frog egg cells and onion epidermis as TAs, our experiments confirm that the spiral PC idler imaging has shown the lowest background but brightest and clearest details, thereby the highest imaging contrast and imaging quality, compared with the traditional MS imaging and bright-field idler imaging. By adding a 40× MS, our setup can “see” easily the spatial structures with a spatial resolution to the several micrometers level. All the experiments work under a weak illuminating intensity of 7nW/cm2. OPA gain increases with pump intensity, which, if pumped by femtosecond laser pulses, can be up to hundreds of gigawatts per square centimeter. This means our design can be further promoted by increasing pump intensity, which allows optical imaging with a weak illumination to reduce the damage for the TA or the required power of the illuminating source. In addition, the non-collinear alignment for OPA separates spatially the idler beam from both the illuminating signal and the intense pump, thus effectively avoiding background noises from both. Overall, our spiral PC idler imaging can work with high imaging contrast, high spatial resolution, weak illumination, and nonlinear frequency conversion (if needed), thus presenting a powerful way for non-destructive biological tissue imaging.

    References

    [1] G. T. Kennedy, F. S. Azari, E. Bernstein, B. Nadeem, A. Chang, A. Segil, S. Carlin, N. T. Sullivan, E. Encarnado, C. Desphande, S. Kularatne, P. Gagare, M. Thomas, J. C. Kucharczuk, G. Christien, F. Lacombe, K. Leonard, P. S. Low, A. Criton, S. Singhal. Targeted detection of cancer at the cellular level during biopsy by near-infrared confocal laser endomicroscopy. Nat. Commun., 13, 2711(2022).

    [2] Z. Feng, T. Tang, T. Wu, X. Yu, Y. Zhang, M. Wang, J. Zheng, Y. Ying, S. Chen, J. Zhou, X. Fan, D. Zhang, S. Li, M. Zhang, J. Qian. Perfecting and extending the near-infrared imaging window. Light Sci. Appl., 10, 197(2021).

    [3] Y. Shi, Z. Zhang. Nonlinear photoacoustic imaging dedicated to thermal-nonlinearity characterization. Chin. Opt. Lett., 19, 071702(2021).

    [4] K. Y. Zhang, Q. Yu, H. Wei, S. Liu, Q. Zhao, W. Huang. Long-lived emissive probes for time-resolved photoluminescence bioimaging and biosensing. Chem. Rev., 118, 1770(2018).

    [5] R. Atchudan, T. N. J. I. Edisona, K. R. Aseer, S. Perumal, N. Karthik, Y. R. Lee. Highly fluorescent nitrogen-doped carbon dots derived from Phyllanthus acidus utilized as a fluorescent probe for label-free selective detection of Fe3+ ions, live cell imaging and fluorescent ink. Biosens. Bioelectron., 99, 303(2018).

    [6] H. Zhou, X. Zeng, A. Li, W. Zhou, L. Tang, W. Hu, Q. Fan, X. Meng, H. Deng, L. Duan, Y. Li, Z. Deng, X. Hong, Y. Xiao. Upconversion NIR-II fluorophores for mitochondria-targeted cancer imaging and photothermal therapy. Nat. Commun., 11, 6183(2020).

    [7] F. Zernike. Phase contrast, a new method for the microscopic observation of transparent objects. Physica, 9, 686(1942).

    [8] J. Chen. Differential interference contrast. Opt. Instrum., 6, 1(1984).

    [9] A. Edstrom, A. Lubk, J. Rusz. Quantum mechanical treatment of atomic-resolution differential phase contrast imaging of magnetic materials. Phys. Rev. B., 99, 174428(2019).

    [10] P. Huo, C. Zhang, W. Zhu, M. Liu, S. Zhang, S. Zhang, L. Chen, H. J. Lezec, A. Agrawal, Y. Lu, T. Xu. Photonic spin-multiplexing metasurface for switchable spiral phase contrast imaging. Nano Lett., 20, 2791(2020).

    [11] L. Li, Y. Zheng, H. Liu, X. Chen. Reconstitution of optical orbital angular momentum through strongly scattering media via feedback-based wavefront shaping method. Chin. Opt. Lett., 19, 100101(2021).

    [12] J. Wang, J. Y. Yang, I. M. Fazal, N. Ahmed, Y. Yan, H. Huang, Y. Ren, Y. Yue, S. Dolinar, M. Tur, A. E. Willner. Terabit free-space data transmission employing orbital angular momentum multiplexing. Nat. Photonics, 6, 488(2012).

    [13] T. Vicar, J. Balvan, J. Jaros, F. Jug, R. Kolar, M. Masarik, J. Gumulec. Cell segmentation methods for label-free contrast microscopy: review and comprehensive comparison. BMC Bioinform., 20, 360(2019).

    [14] J. A. Davis, D. E. McNamara, D. M. Cottrell, J. Campos. Image processing with the radial Hilbert transform: theory and experiments. Opt. Lett., 25, 99(2000).

    [15] M. Trusiak, M. Cywińska, V. Micó, J. Á. Picazo-Bueno, C. Zuo, P. Zdańkowski, K. Patorski. Variational Hilbert quantitative phase imaging. Sci. Rep., 10, 13955(2020).

    [16] A. Jesacher, S. Furhapter, S. Bernet, M. Ritsch-Marte. Shadow effects in spiral phase contrast microscopy. Phys. Rev. Lett., 94, 233902(2005).

    [17] X. Qiu, F. Li, W. Zhang, Z. Zhu, L. Chen. Spiral phase contrast imaging in nonlinear optics: seeing phase objects using invisible illumination. Optica, 5, 208(2018).

    [18] S. K. Liu, C. Yang, S. L. Liu, Z. Y. Zhou, Y. Li, Y. H. Li, Z. H. Xu, G. C. Guo, B. S. Shi. Up-conversion imaging processing with field-of-view and edge enhancement. Phys. Rev. Appl., 11, 044013(2019).

    [19] S. Junaid, P. Tidemand-Lichtenberg, C. Pedersen, P. J. Rodrigo. Upconversion dark-field imaging with extended field of view at video frame rate. Appl. Opt., 59, 2157(2020).

    [20] X. Zeng, Y. Cai, W. Chen, S. Zheng, J. Li, T. Zhu, S. Xu. High spatially resolved idler image with a compact non-collinear optical parametric amplifier using a CW laser as signal. IEEE Photonics J., 7, 6804107(2015).

    [21] X. Zeng, Y. Cai, W. Chen, J. Li, S. Zheng, T. Zhu, S. Xu. High resolved non-collinear idler imaging via type-II angular noncritical phase-matching. IEEE Photon. Technol. Lett., 28, 2685(2016).

    [22] I. V. Sokolov, M. I. Kolobov, L. A. Lugiato. Quantum fluctuations in traveling-wave amplification of optical images. Phys. Rev. A, 60, 2420(1999).

    [23] C. S. Guo, Y. J. Han, J. B. Xu, J. Ding. Radial Hilbert transform with Laguerre-Gaussian spatial filters. Opt. Lett., 31, 1394(2006).

    [24] S. Furhapter, A. Jesacher, S. Bernet, M. Ritsch-Marte. Spiral phase contrast imaging in microscopy. Opt. Express, 13, 689(2005).

    [25] R. W. Boyd. Nonlinear Optics(2002).

    [26] G. Agrawal. Nonlinear Fiber Optics(2013).

    [27] P. A. Morris, R. S. Aspden, J. E. Bell, R. W. Boyd, M. J. Padgett. Imaging with a small number of photons. Nat. Commun., 6, 5913(2015).

    Xuanke Zeng, Congying Wang, Yi Cai, Qinggang Lin, Xiaowei Lu, Jiahe Lin, Xinming Yuan, Wenhua Cao, Yuexia Ai, Shixiang Xu. High spatial-resolution biological tissue imaging in the second near-infrared region via optical parametric amplification pumped by an ultrafast vortex pulse [Invited][J]. Chinese Optics Letters, 2022, 20(10): 100003
    Download Citation