
Yulei Chi, Lin Sun, Jing Wei. Improved Dynamic Threshold Cloud Detection Algorithm for Suomi-NPP Visible Infrared Imaging Radiometer[J]. Acta Optica Sinica, 2019, 39(5): 0528005
- Acta Optica Sinica
- Vol. 39, Issue 5, 0528005 (2019)
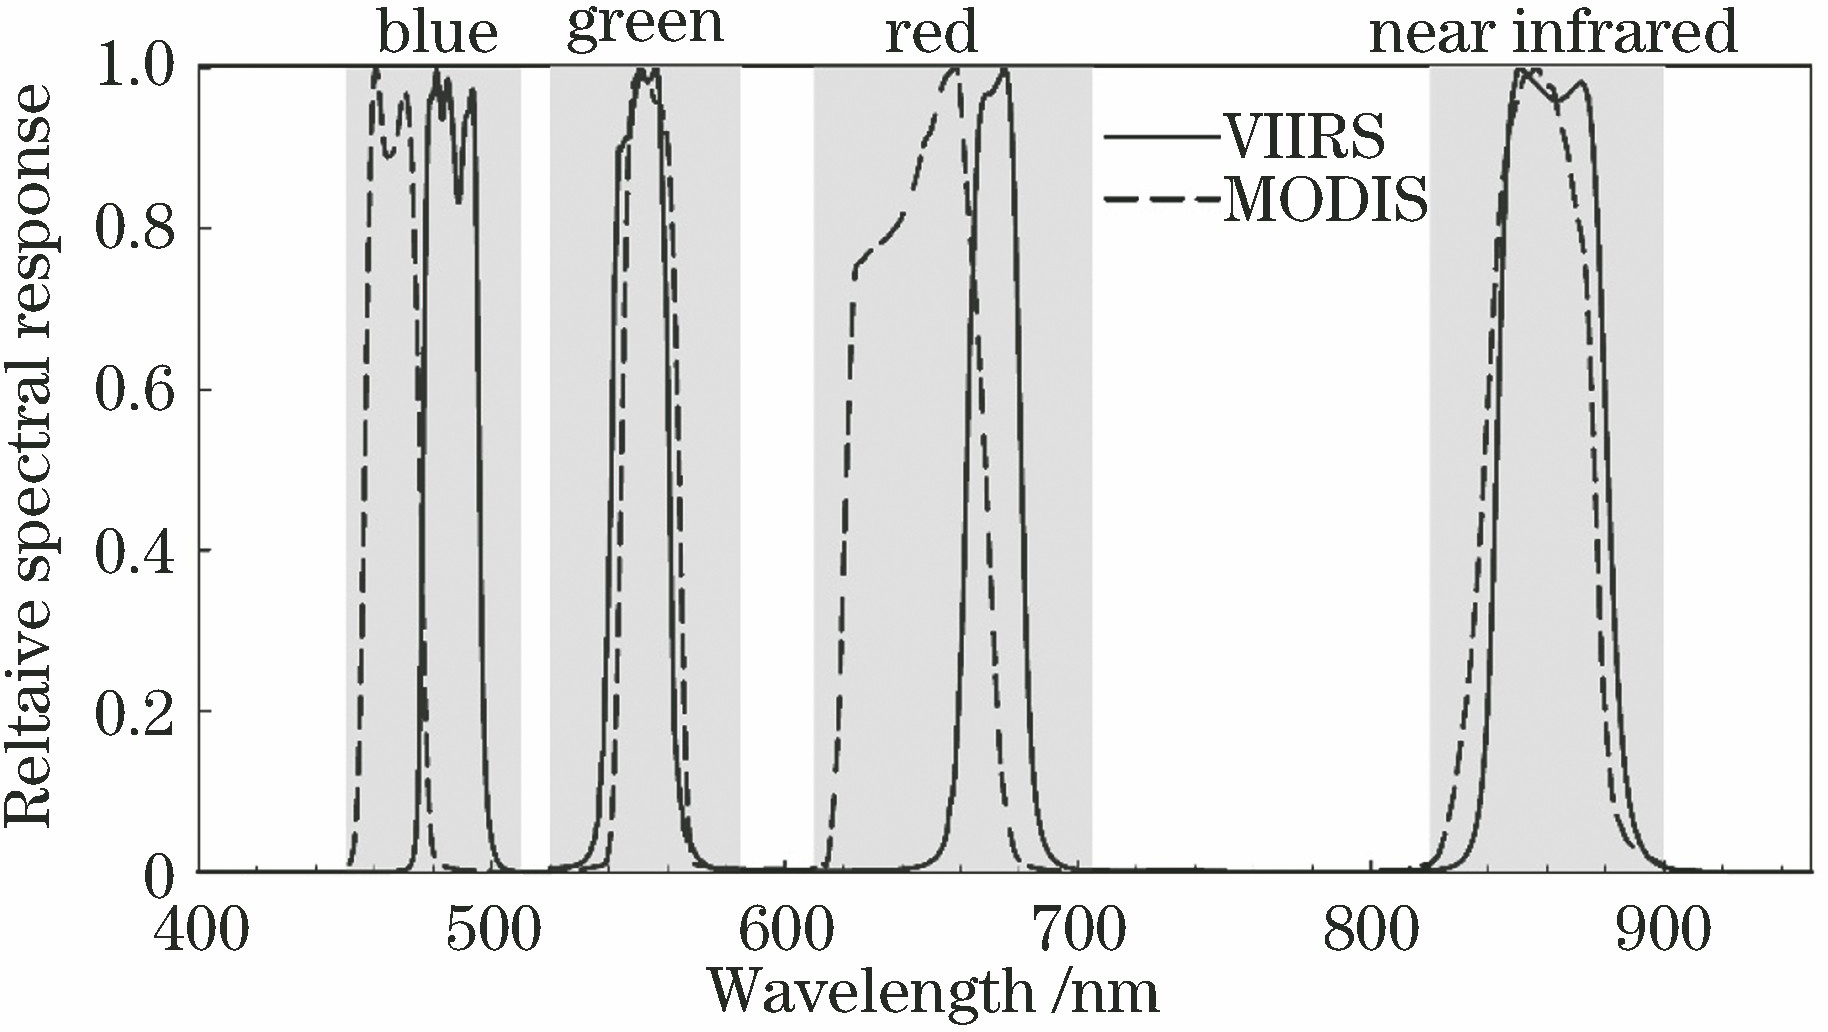
Fig. 1. Spectral response curves of VIIRS and MODIS sensors
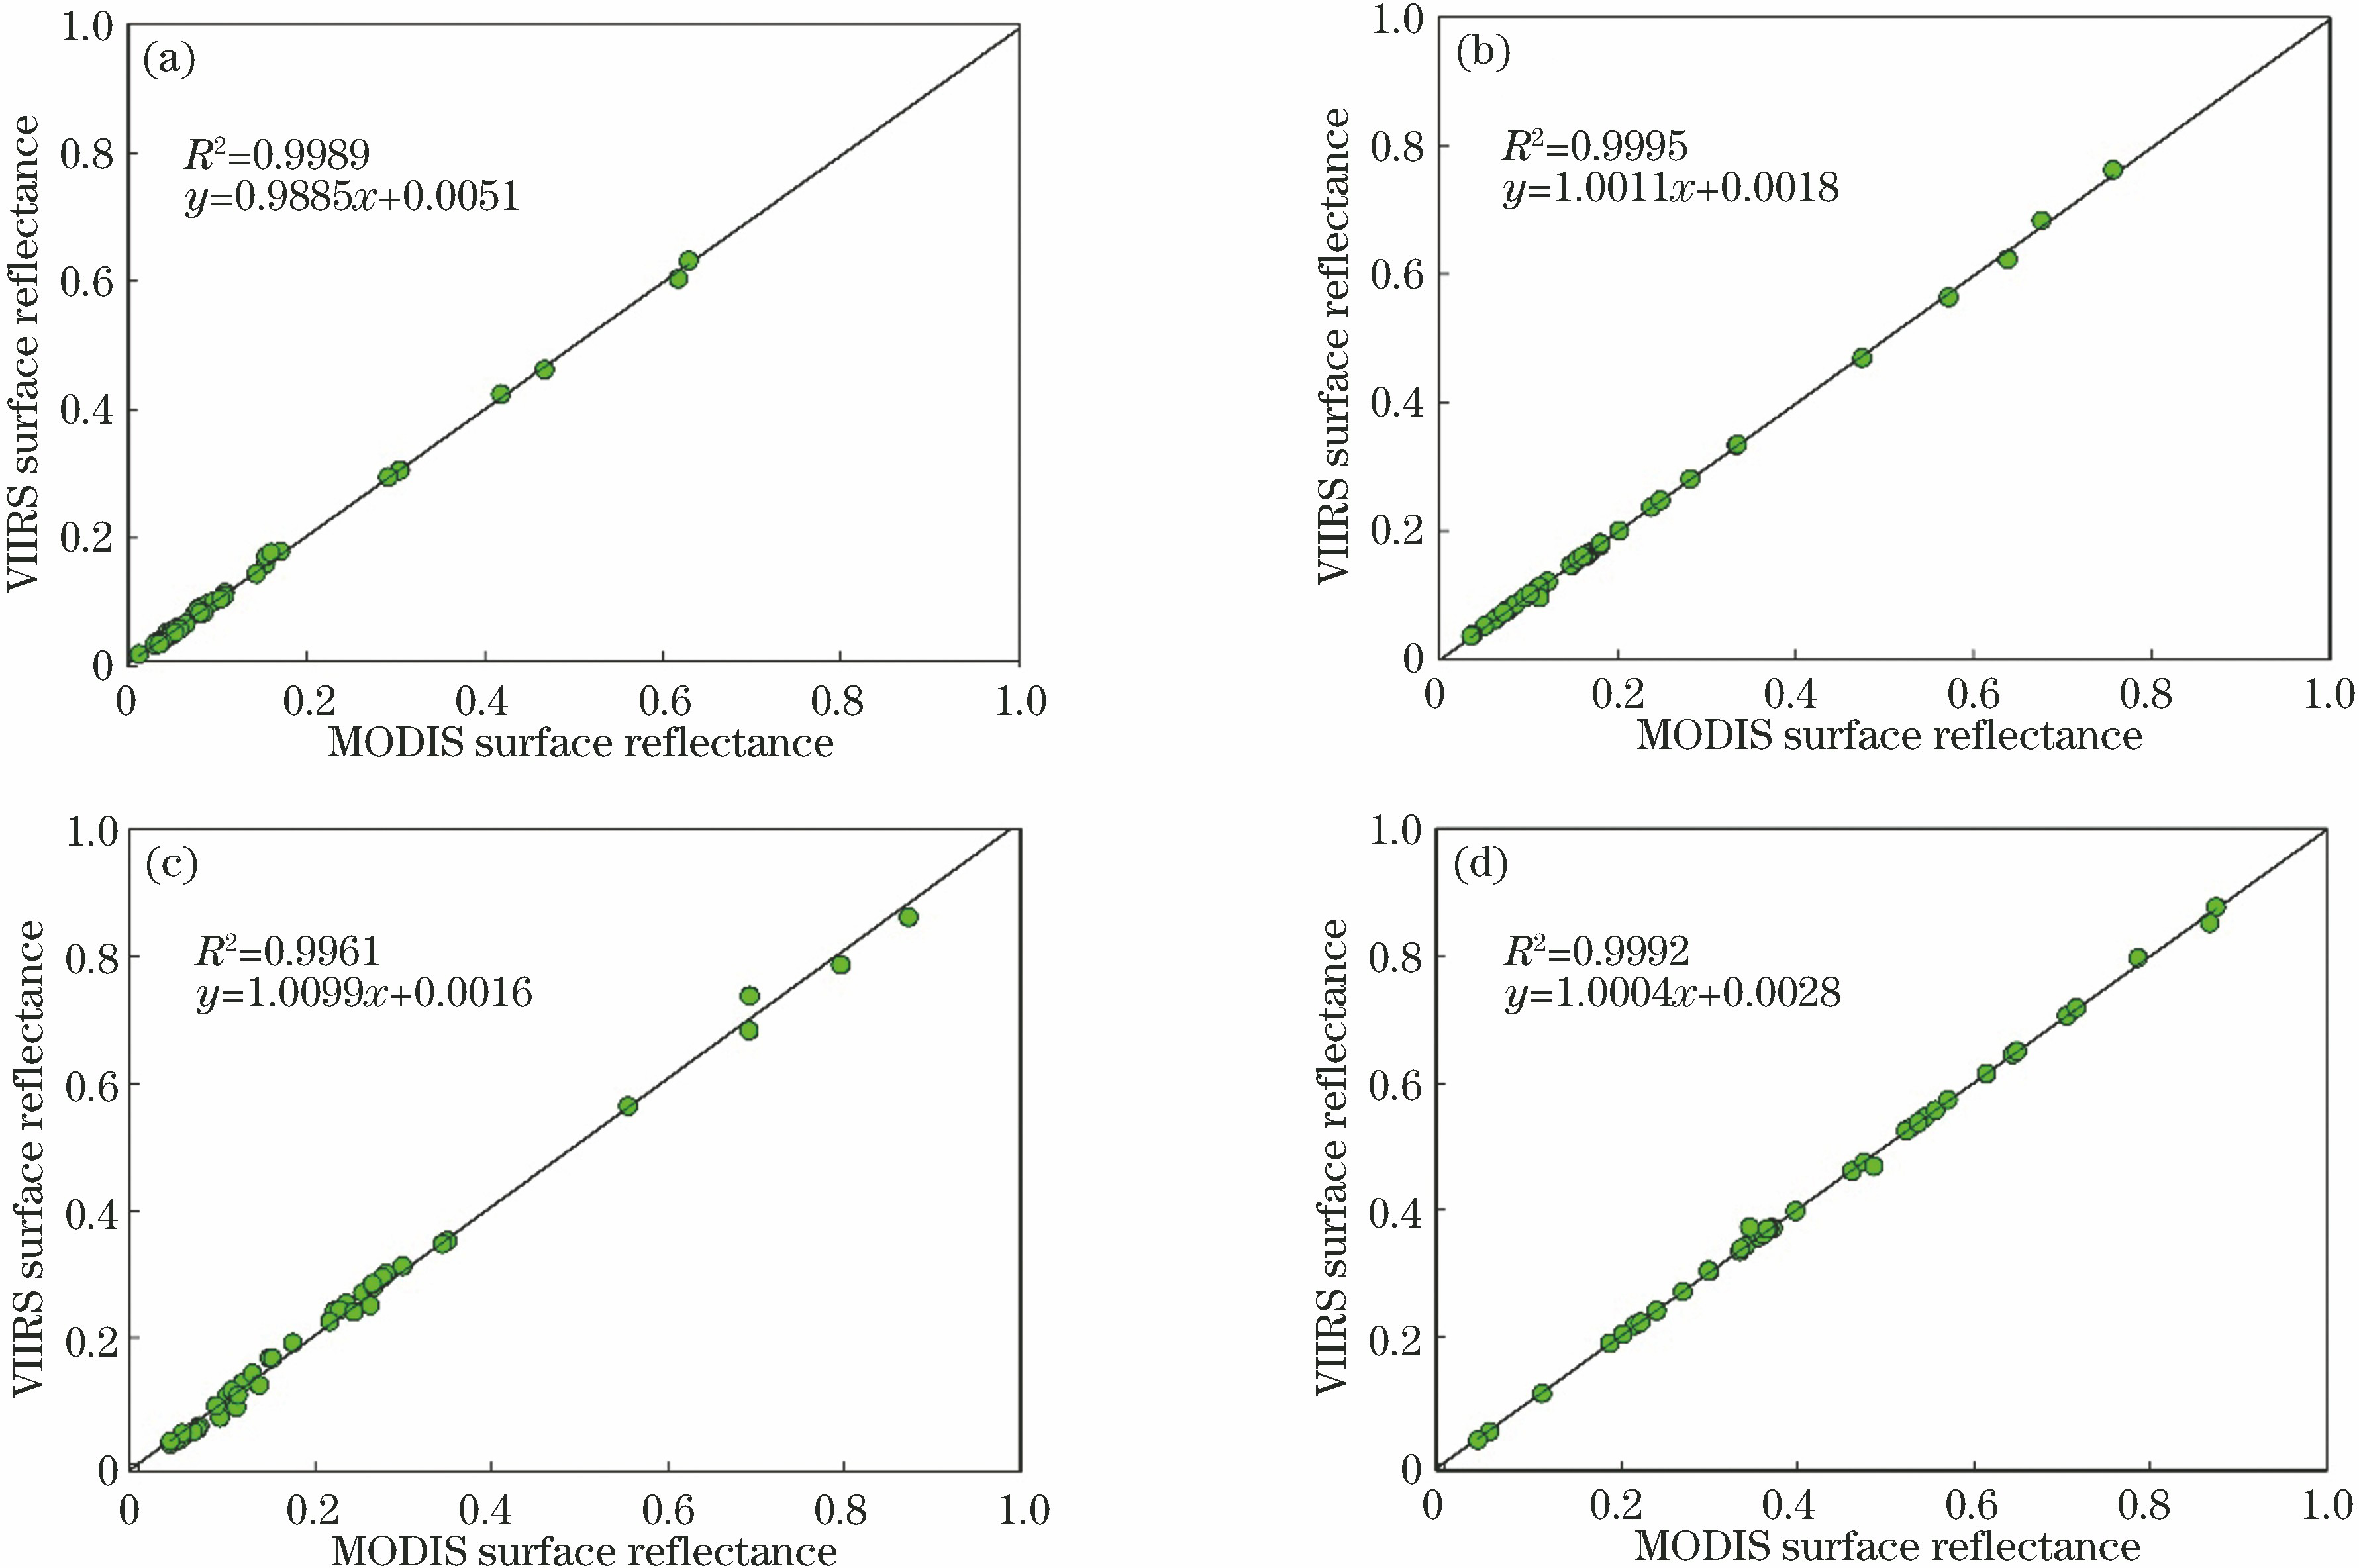
Fig. 2. Land surface reflectance of VIIRS and MODIS sensors in different channels. (a) Blue band; (b) green band; (c) red band; (d) near infrared band
Fig. 3. Distributions of land surface reflectance and brightness temperature for different surface features. (a) Reflectance and brightness temperature; (b) brightness temperature difference
Fig. 4. Three-dimensional distributions of brightness temperature for different surface features
Fig. 5. Flow chart of I-DTCDA algorithm for VIIRS data
Fig. 6. Comparison of cloud detection results between UDTCDA and I-DTCDA algorithms for different surface features. (a) Desert, 2014-09-24; (b) desert ,2014-08-12; (c) bare land, 2014-07-09; (d) bare land,2014-06-23; (e) water, 2014-03-20; (f) water,2014-04-23; (g) snow,2014-06-06; (h) snow, 2014-06-20
Fig. 7. Comparisonof cloud detection results between I-DTCDA and VCM algorithms for different surface features. (a) Desert, 2014-06-04; (b) desert, 2014-07-15; (c) bare land, 2014-05-17; (d) bare land, 2014-07-29; (e) water, 2014-10-23; (f) water, 2014-11-13; (g) snow, 2014-02-06; (h) snow, 2014-11-18
Fig. 8. Comparison in overall accuracy between detected and true cloud concentrations for different cloud detection algorithms
|
Table 1. Parameters of cloud-detection bands for VIIRS
|
Table 2. Evaluation results of thin cloud detection accuracy

Set citation alerts for the article
Please enter your email address
© Copyright 2018-2021 | Chinese Laser Press. All Rights Reserved 沪ICP备15018463号-20