
Qin Li, Xiyuan Chai, Yungai Tang, Gai Wang, Congfeng Wu. Design and test of X-band high power loads[J]. High Power Laser and Particle Beams, 2022, 34(4): 043007
- High Power Laser and Particle Beams
- Vol. 34, Issue 4, 043007 (2022)
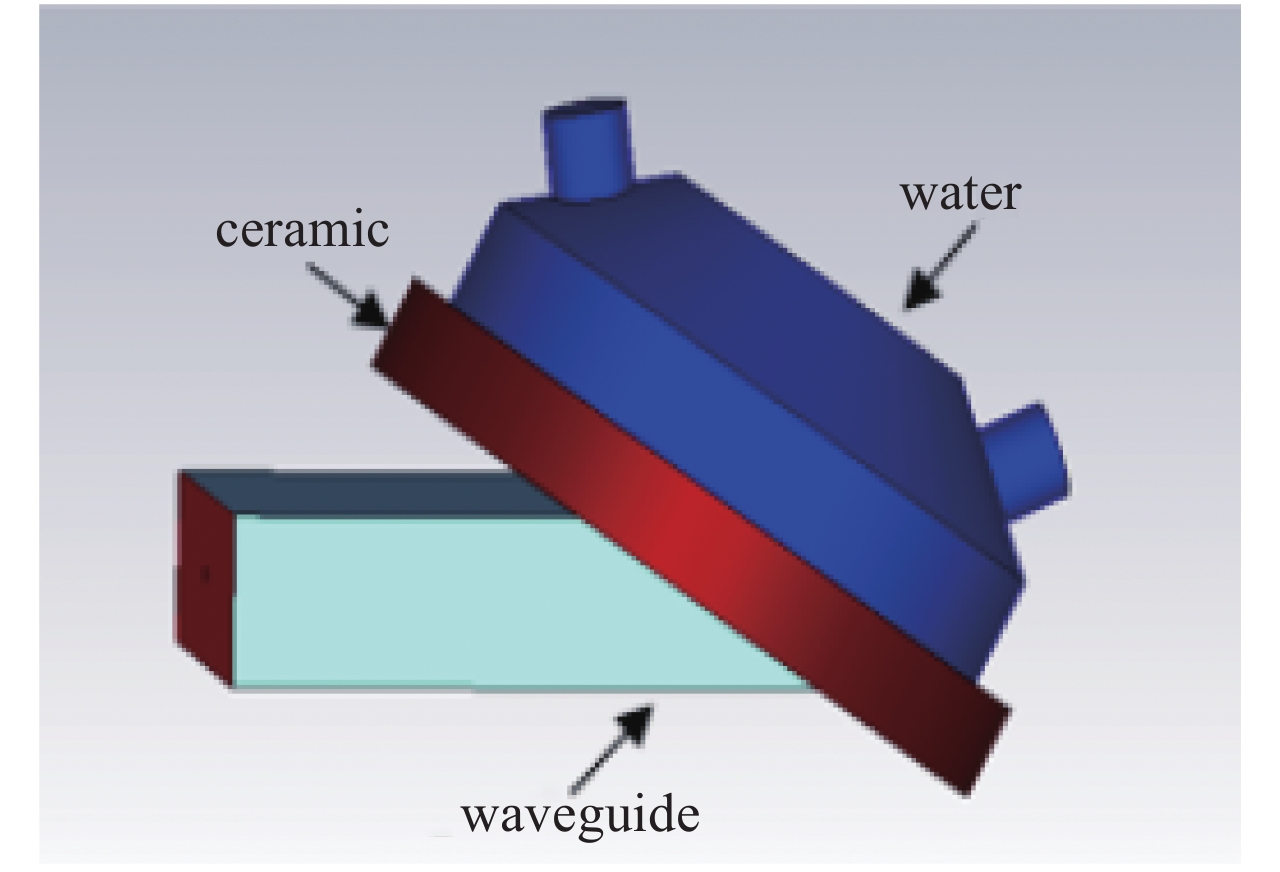
Fig. 1. Water load in CST
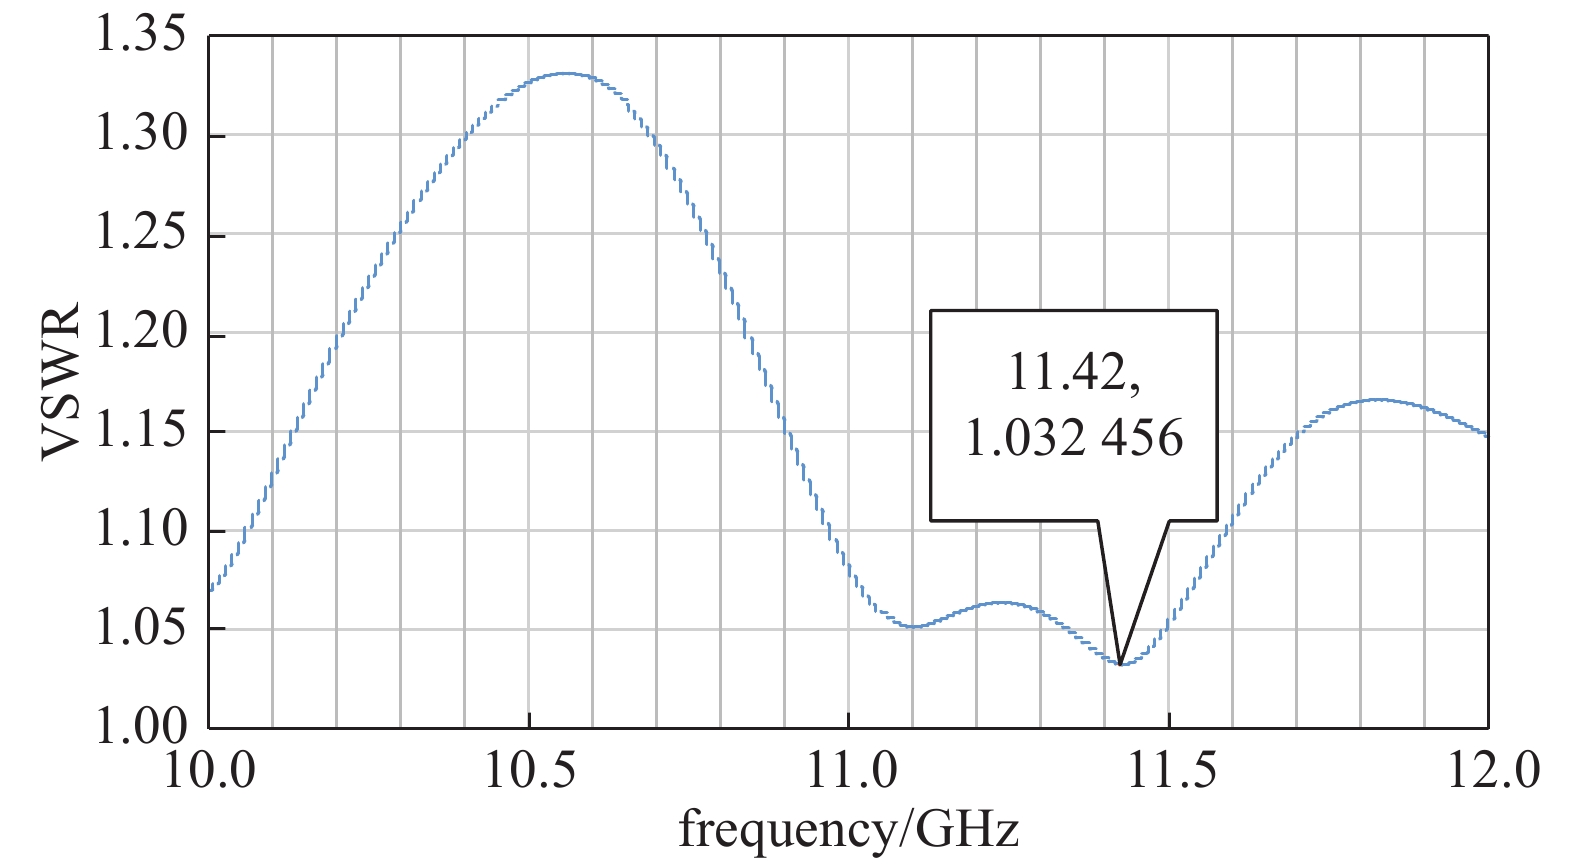
Fig. 2. VSWR of water load by CST
Fig. 3. Electric field of water load in CST
Fig. 4. Water load
Fig. 5. Effect of relative dielectric constant of ceramic on VSWR
Fig. 6. Effect of loss tangent of ceramic on VSWR
Fig. 7. Effect of relative dielectric constant of water on VSWR
Fig. 8. Effect of loss tangent of water on VSWR
Fig. 9. New water load in CST
Fig. 10. VSWR of new water load by CST
Fig. 11. Electric field of water load in CST
Fig. 12. New water load
Fig. 13. Water load measurement result (VSWR=1.0582)
Fig. 14. New water load measurement result (VSWR=1.0763)
Fig. 15. Cylinder-shaped water load in CST
Fig. 16. VSWR of cylinder-shaped water load by CST
Fig. 17. Electric field of cylinder-shaped water load in CST
Fig. 18. Dry load in CST
Fig. 19. Aligned (a) and staggered structure (b)
Fig. 20. Electric field in CST (aligned structure)
Fig. 21. Electric field in CST (staggered structure)
Fig. 22. VSWR of dry load by CST
Fig. 23. Temperature distribution (aligned structure)
Fig. 24. Temperature distribution (staggered structure)
Fig. 25. Stress distribution (aligned structure)
Fig. 26. Stress distribution (staggered structure)
Fig. 27. Deformation distribution (aligned structure)
Fig. 28. Deformation distribution (staggered structure)
Fig. 29. Effect of coupling length on VSWR
Fig. 30. Effect of absorption tooth radius on VSWR
Fig. 31. Structure of the new dry load
Fig. 32. Electric field in CST of the new dry load
Fig. 33. VSWR of the new dry load by CST
Fig. 34. Temperature distribution of the new dry load
Fig. 35. Stress distribution of the new dry load
Fig. 36. Deformation distribution of the new dry load
|
Table 1. Load design requirements
|
Table 2. Dielectric properties of water at 10 GHz

Set citation alerts for the article
Please enter your email address
© Copyright 2018-2021 | Chinese Laser Press. All Rights Reserved 沪ICP备15018463号-20