• Laser & Optoelectronics Progress
  • Vol. 58, Issue 12, 1210003 (2021)
Lingling Xiong1、2, Qinkai Liao1、2, Shanling Lin2、3, Zhixian Lin1、2、*, and Tailiang Guo1、2
Author Affiliations
  • 1College of Physics and Information Engineering, Fuzhou University, Fuzhou, Fujian 350116, China
  • 2Fujian Science & Technology Innovation Laboratory for Optoelectronic Information of China, Fuzhou, Fujian 350116, China
  • 3School of Advanced Manufacturing, Fuzhou University, Quanzhou, Fujian 362200, China
  • show less
    DOI: 10.3788/LOP202158.1210003 Cite this Article Set citation alerts
    Lingling Xiong, Qinkai Liao, Shanling Lin, Zhixian Lin, Tailiang Guo. Defect Detection of Electrowetting Display Based on Histogram Gradient Weighting[J]. Laser & Optoelectronics Progress, 2021, 58(12): 1210003 Copy Citation Text show less
    Segmentation result of the image (a) Original image; (b) processing result of the Otsu method; (c) gray histogram and threshold
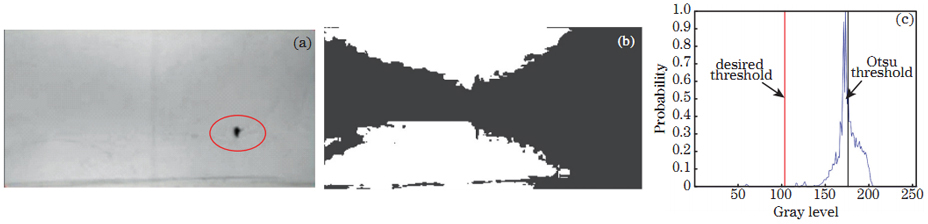
    Fig. 1. Segmentation result of the image (a) Original image; (b) processing result of the Otsu method; (c) gray histogram and threshold
    Acquisition of the peak information of image. (a) Gray histogram and its gradient; (b) cumulant of the gray histogram; (c) gradient cumulant of the gray histogram
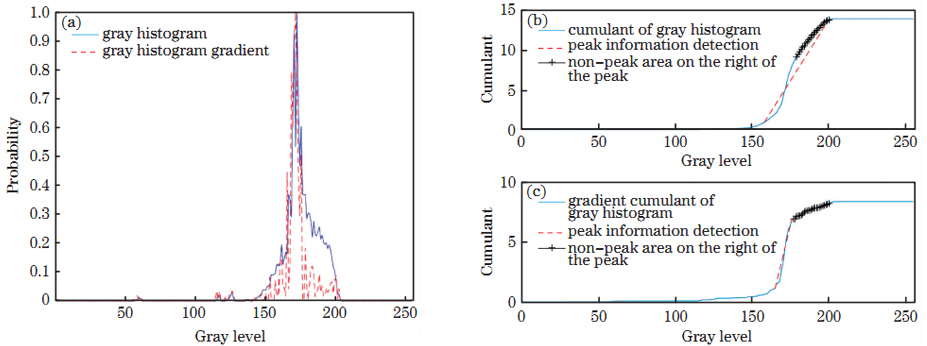
    Fig. 2. Acquisition of the peak information of image. (a) Gray histogram and its gradient; (b) cumulant of the gray histogram; (c) gradient cumulant of the gray histogram
    Normalized k(t) change curve with the gray-scale histogram
    Fig. 3. Normalized k(t) change curve with the gray-scale histogram
    Segmentation result of the electrowetting image 1. (a) Original image; (b) VE method; (c) Otsu method; (d) WOV method; (e) EW method; (f) GW method; (g) grayscale histogram and threshold
    Fig. 4. Segmentation result of the electrowetting image 1. (a) Original image; (b) VE method; (c) Otsu method; (d) WOV method; (e) EW method; (f) GW method; (g) grayscale histogram and threshold
    Segmentation result of the electrowetting image 2. (a) Original image; (b) VE method; (c) Otsu method; (d) WOV method; (e) EW method; (f) GW method; (g) gray histogram and threshold
    Fig. 5. Segmentation result of the electrowetting image 2. (a) Original image; (b) VE method; (c) Otsu method; (d) WOV method; (e) EW method; (f) GW method; (g) gray histogram and threshold
    Segmentation result of the electrowetting image 3. (a) Original image; (b) VE method; (c) Otsu method; (d) WOV method; (e) EW method; (f) GW method; (g) grayscale histogram and threshold
    Fig. 6. Segmentation result of the electrowetting image 3. (a) Original image; (b) VE method; (c) Otsu method; (d) WOV method; (e) EW method; (f) GW method; (g) grayscale histogram and threshold
    Segmentation result of the fabric defect image 1. (a) Original image; (b) VE method; (c) Otsu method; (d) WOV method; (e) EW method; (f) GW method; (g) grayscale histogram and threshold
    Fig. 7. Segmentation result of the fabric defect image 1. (a) Original image; (b) VE method; (c) Otsu method; (d) WOV method; (e) EW method; (f) GW method; (g) grayscale histogram and threshold
    Segmentation result of the fabric defect image 2. (a) Original image; (b) VE method; (c) Otsu method; (d) WOV method; (e) EW method; (f) GW method; (g) grayscale histogram and threshol
    Fig. 8. Segmentation result of the fabric defect image 2. (a) Original image; (b) VE method; (c) Otsu method; (d) WOV method; (e) EW method; (f) GW method; (g) grayscale histogram and threshol
    Segmentation result of the welding defect image. (a) Original image; (b) VE method; (c) Otsu method; (d) WOV method; (e) EW method; (f) GW method; (g) grayscale histogram and threshold
    Fig. 9. Segmentation result of the welding defect image. (a) Original image; (b) VE method; (c) Otsu method; (d) WOV method; (e) EW method; (f) GW method; (g) grayscale histogram and threshold
    Segmentation result of the wood defect image. (a) Original image; (b) VE method; (c) Otsu method; (d) WOV method; (e) EW method; (f) GW method; (g) grayscale histogram and threshold
    Fig. 10. Segmentation result of the wood defect image. (a) Original image; (b) VE method; (c) Otsu method; (d) WOV method; (e) EW method; (f) GW method; (g) grayscale histogram and threshold
    ApplicationOtsuVEWOVEWGW
    Image 40.03530.03040.91820.84510.0359
    Image 50.81680.81680.82580.81480.0123
    Image 60.87510.87410.87870.87110.0076
    Image 70.56870.00080.00150.99840.0006
    Image 80.50910.00480.00480.99520.0014
    Image 90.34410.98730.99740.99740.0011
    Image 100.25670.00080.00260.00060.0002
    Average value0.48650.38790.51840.78890.0084
    Table 1. Misclassification values of 5 methods
    ApplicationOtsuVEWOVEWGW
    Image 40.69070.72180.00330.08260.5436
    Image 50.05830.05830.05770.05840.7562
    Image 60.02070.02080.02070.02080.7093
    Image 70.00270.65880.03570.00000.7089
    Image 80.00930.00160.00160.00000.7066
    Image 90.00760.00260.00000.00000.5903
    Image 100.02250.88200.56690.91260.9653
    Average value0.11600.33510.09800.15350.7115
    Table 2. Defect segmentation rates of 5 methods
    Lingling Xiong, Qinkai Liao, Shanling Lin, Zhixian Lin, Tailiang Guo. Defect Detection of Electrowetting Display Based on Histogram Gradient Weighting[J]. Laser & Optoelectronics Progress, 2021, 58(12): 1210003
    Download Citation