
Caowei Zhang, Honghao Ge, Hao Fang, Qunli Zhang, Jianhua Yao. Effect of Solute Redistribution Coefficient on Solute Distribution in Laser Cladding[J]. Chinese Journal of Lasers, 2022, 49(2): 0202012
- Chinese Journal of Lasers
- Vol. 49, Issue 2, 0202012 (2022)
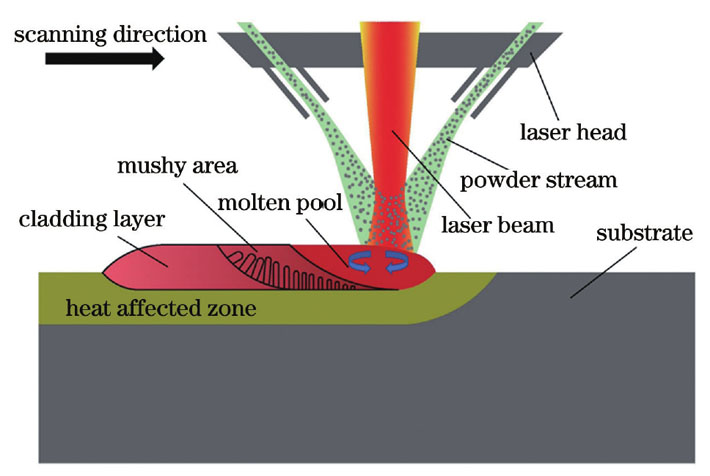
Fig. 1. Schematic of laser cladding
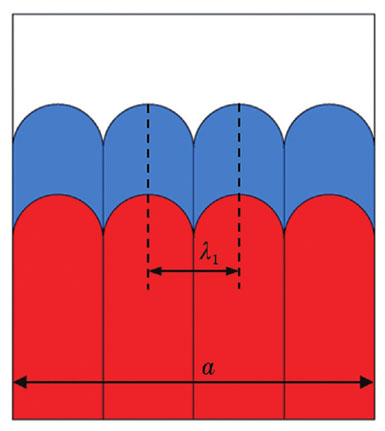
Fig. 2. Growth schematic of dendrite in solid tip grid
Fig. 3. Grid distribution and boundary conditions of computational domain
Fig. 4. Schematic of computation domain evolution in laser cladding process
Fig. 5. Evolution of temperature field during laser cladding. (a)(c) Dynamic solute redistribution coefficient solidification model; (d)(f) constant solute redistribution coefficient solidification model
Fig. 6. Molten pool morphologies during laser cladding (t=2.1 s). (a) Dynamic solute redistribution coefficient solidification model; (b) constant solute redistribution coefficient solidification model; (c) experimental molten pool morphology
Fig. 7. Schematic of solute redistribution coefficient during non-equilibrium solidification
Fig. 8. Simulated flow field distribution (t=2.1 s). (a) Dynamic solute redistribution coefficient solidification model; (b) constant solute redistribution coefficient solidification model
Fig. 9. Simulated Cr element distribution. (a) Dynamic solute redistribution coefficient solidification model; (b) constant solute redistribution coefficient solidification model; (c) metallographic microstructure of samples; (d) point locations in y direction for EDS analysis; (e) point locations in x direction for EDS analysis
Fig. 10. Comparison of simulated and experimental Cr element distributions in y direction. (a) Dynamic solute redistribution coefficient solidification model; (b) constant solute redistribution coefficient solidification model
Fig. 11. Error between Cr mass fractions simulated by two models and experimental data
Fig. 12. Comparison between Cr mass fractions in x direction simulated by two models and experimental data
| |||||||||||||||||||||||||||||||
Table 1. Chemical composition of 45 steel and 316L stainless steel powder
|
| ||||||||||||||||||||||||
Table 3. Predicted cladding layer height and molten pool depth by the two model at different time points

Set citation alerts for the article
Please enter your email address
© Copyright 2018-2021 | Chinese Laser Press. All Rights Reserved 沪ICP备15018463号-20