
Lei Chen, Keng C. Chou. Revisiting the absorption and transmission properties of coupled open waveguides[J]. Photonics Research, 2018, 6(11): 1003
- Photonics Research
- Vol. 6, Issue 11, 1003 (2018)
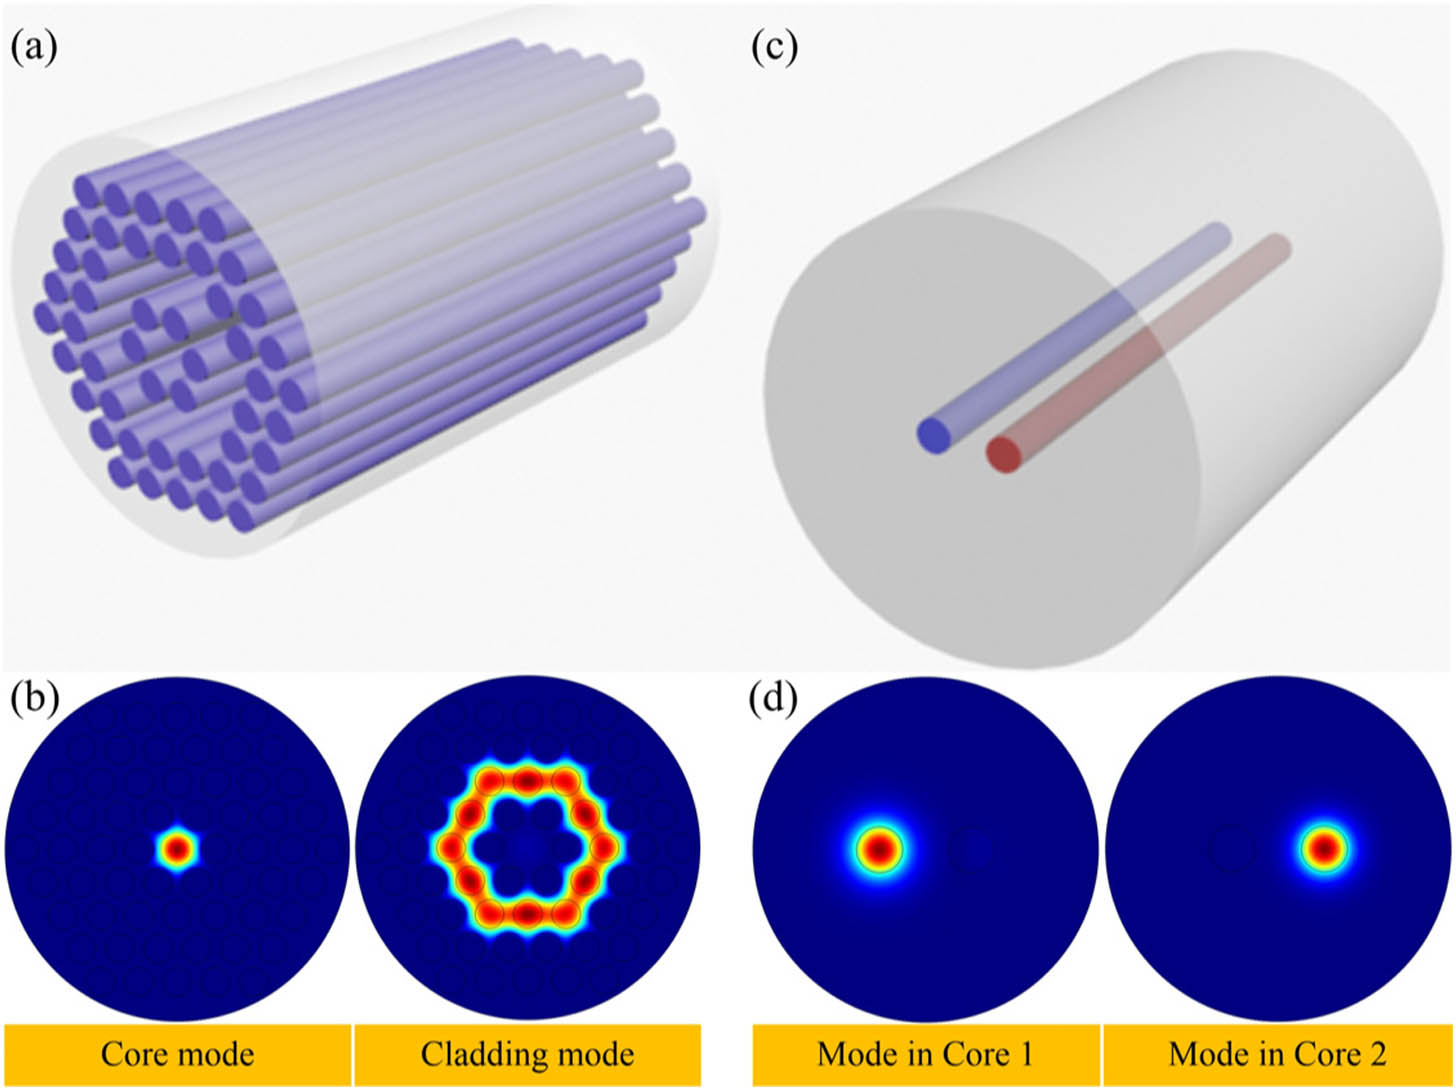
Fig. 1. (a) Representative PCF structure and (b) its dominant core and cladding eigenmodes. (c) Equivalent two-core fiber and (d) its eigenmodes.
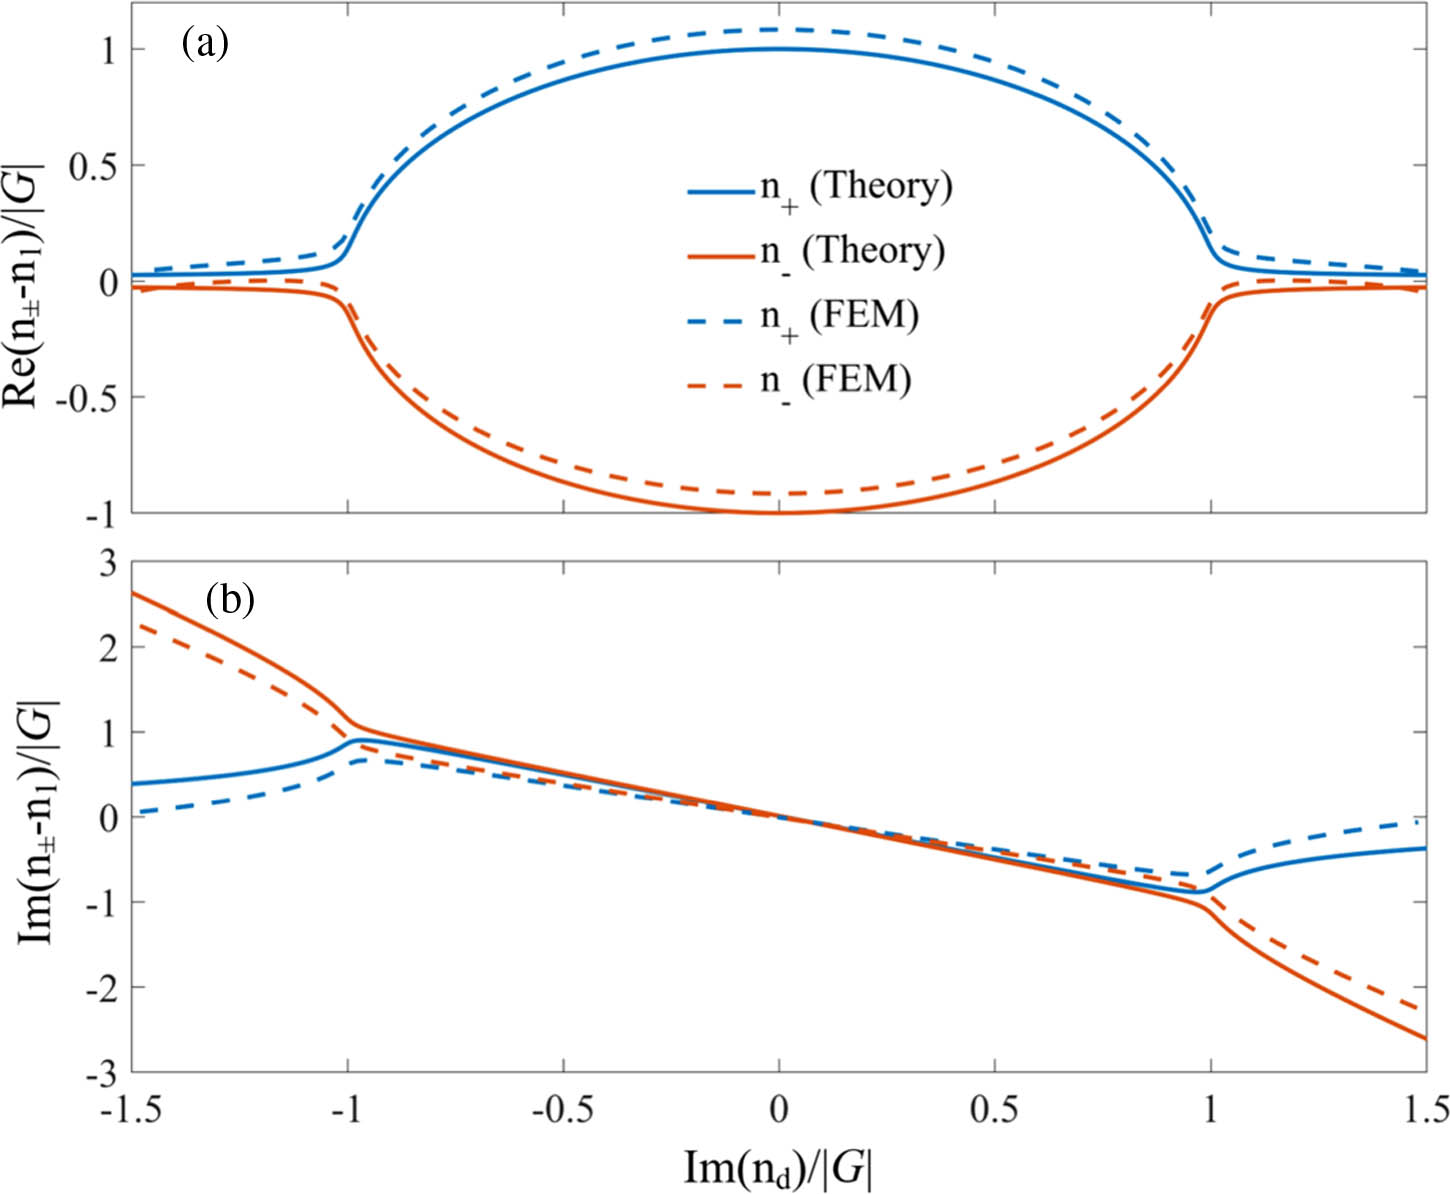
Fig. 2. (a) Real and (b) imaginary parts of n + n − Im ( n d ) / | G |
Fig. 3. Eigenvalues of the coupled system n + n − λ Im ( n d ) / | G | − 0.25 − 1 − 1.5
Fig. 4. Transmission spectra obtained by (a), (d) the conventional formulism, (b), (e) the quantum formulism, and (c), (f) the BPM simulation with Im ( n d ) / | G |
Fig. 5. Transmission spectrum as a function of the propagation length with Im ( n d ) / | G | − 1 − 1.5
Fig. 6. Eigenmode overlap factor at the phase matching point (1.55 μm).
Fig. 7. Phase diagram in a λ Im ( n d ) / | G |

Set citation alerts for the article
Please enter your email address
© Copyright 2018-2021 | Chinese Laser Press. All Rights Reserved 沪ICP备15018463号-20