• Acta Optica Sinica
  • Vol. 37, Issue 9, 0911001 (2017)
Fang Lin1、2, Jincheng Wang1、2, Hua Zhang1、2, Wuhu Lei1、2, and Yihua Hu1、2、*
Author Affiliations
  • 1 State Key Laboratory of Pulsed Power Laser Technology, Electronic Engineering Institute, Hefei, Anhui 230037, China
  • 2 Anhui Province Key Laboratory of Electronic Restriction, Electronic Engineering Institute, Hefei, Anhui 230037, China
  • show less
    DOI: 10.3788/AOS201737.0911001 Cite this Article Set citation alerts
    Fang Lin, Jincheng Wang, Hua Zhang, Wuhu Lei, Yihua Hu. Application of Multi-Frame Iterative Blind Deconvolution Methodin Laser Reflective Tomography Imaging[J]. Acta Optica Sinica, 2017, 37(9): 0911001 Copy Citation Text show less
    Schematic of LRT
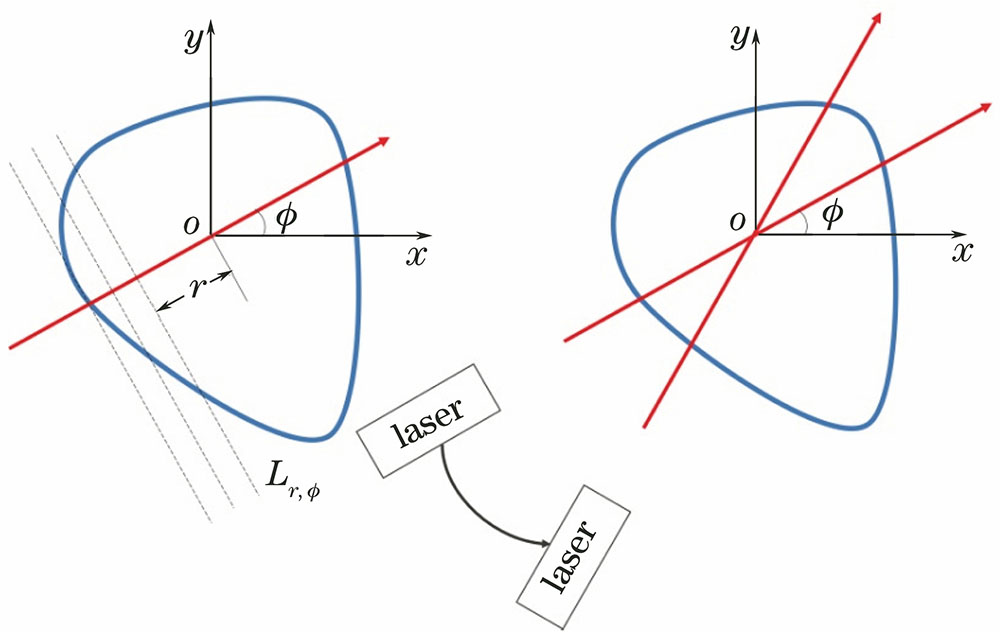
    Fig. 1. Schematic of LRT
    Flow chart of IBWF algorithm
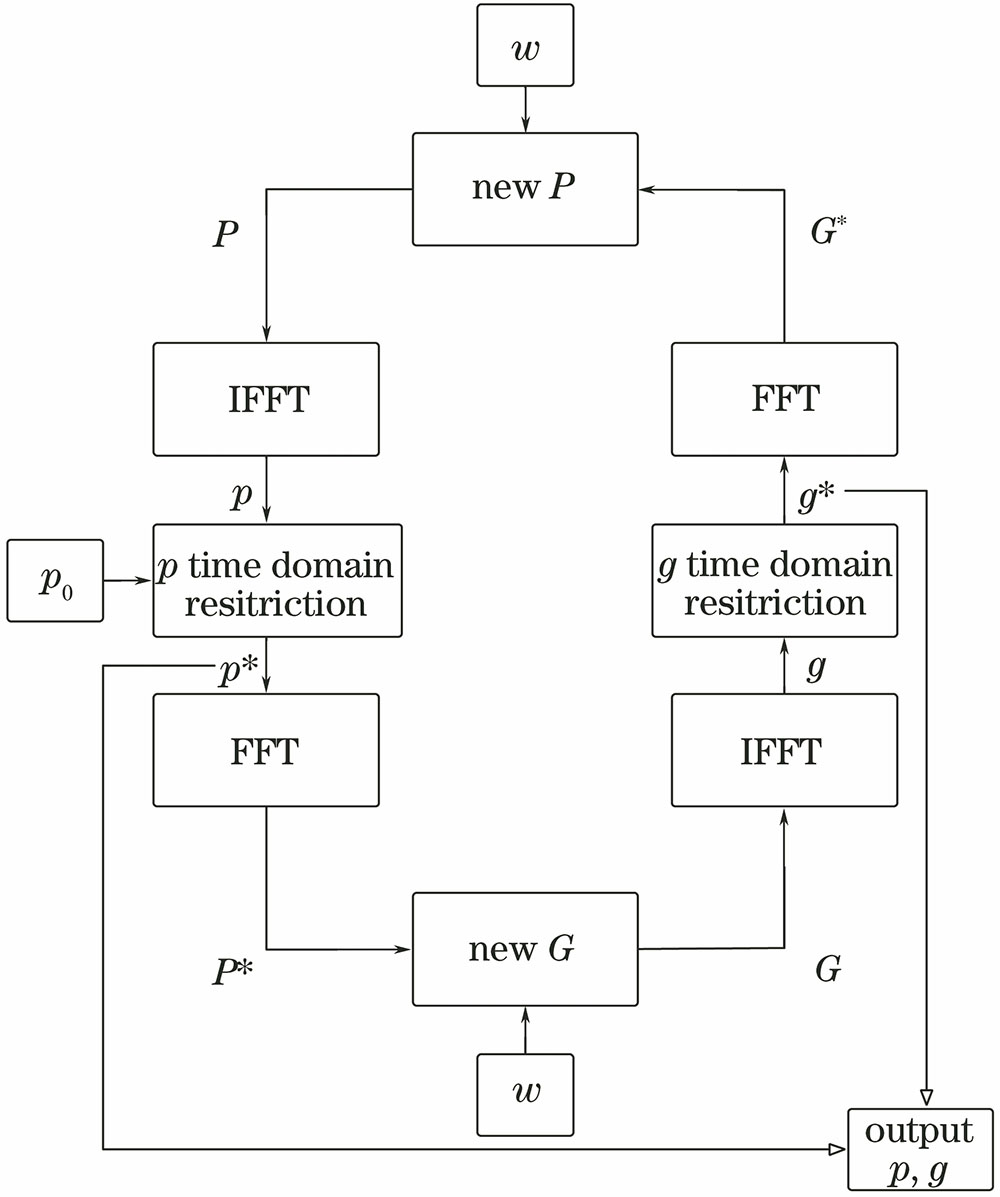
    Fig. 2. Flow chart of IBWF algorithm
    Flow chart of multi-frame iterative blind deconvolution algorithm
    Fig. 3. Flow chart of multi-frame iterative blind deconvolution algorithm
    Simulation experiment results of multi-frame iterative deconvolution algorithm. (a)(b) Square; (c)(d) double circle; (e)(f) five-pointed star
    Fig. 4. Simulation experiment results of multi-frame iterative deconvolution algorithm. (a)(b) Square; (c)(d) double circle; (e)(f) five-pointed star
    Comprision of deconvolution results with differentsignal to noise ratio. (a)-(h) Signal to noise ratio of 1 dB, 6 dB, 11 dB, 16 dB, 21 dB, 26 dB, 31 dB, 36 dB, respectively
    Fig. 5. Comprision of deconvolution results with differentsignal to noise ratio. (a)-(h) Signal to noise ratio of 1 dB, 6 dB, 11 dB, 16 dB, 21 dB, 26 dB, 31 dB, 36 dB, respectively
    Variation of reconstructed image error metric with signal to noise ratio
    Fig. 6. Variation of reconstructed image error metric with signal to noise ratio
    Pulse resolution of multi-frame iterative deconvolution algorithm. (a) Before deconvolution; (b) after NCWF; (c) after IBWF
    Fig. 7. Pulse resolution of multi-frame iterative deconvolution algorithm. (a) Before deconvolution; (b) after NCWF; (c) after IBWF
    Variation of contrast with number of IBWF iterations
    Fig. 8. Variation of contrast with number of IBWF iterations
    Schematic of LRT experimental system
    Fig. 9. Schematic of LRT experimental system
    Schematic of deconvolution effect. (a) Original reconstructed image; (b) after threshold processing; (c) after deconvolution
    Fig. 10. Schematic of deconvolution effect. (a) Original reconstructed image; (b) after threshold processing; (c) after deconvolution
    Fang Lin, Jincheng Wang, Hua Zhang, Wuhu Lei, Yihua Hu. Application of Multi-Frame Iterative Blind Deconvolution Methodin Laser Reflective Tomography Imaging[J]. Acta Optica Sinica, 2017, 37(9): 0911001
    Download Citation