
Jiasen Huang, Chuang Cai, Zhijie Liu, Hanping Wang, Jia Xie, Jie Yu, Yonghong Liu. Microstructure and Mechanical Properties of Laser Welded Inconel690 Nickel-Based Alloy/SUS304 Stainless Steel Joints[J]. Acta Optica Sinica, 2023, 43(10): 1014001
- Acta Optica Sinica
- Vol. 43, Issue 10, 1014001 (2023)
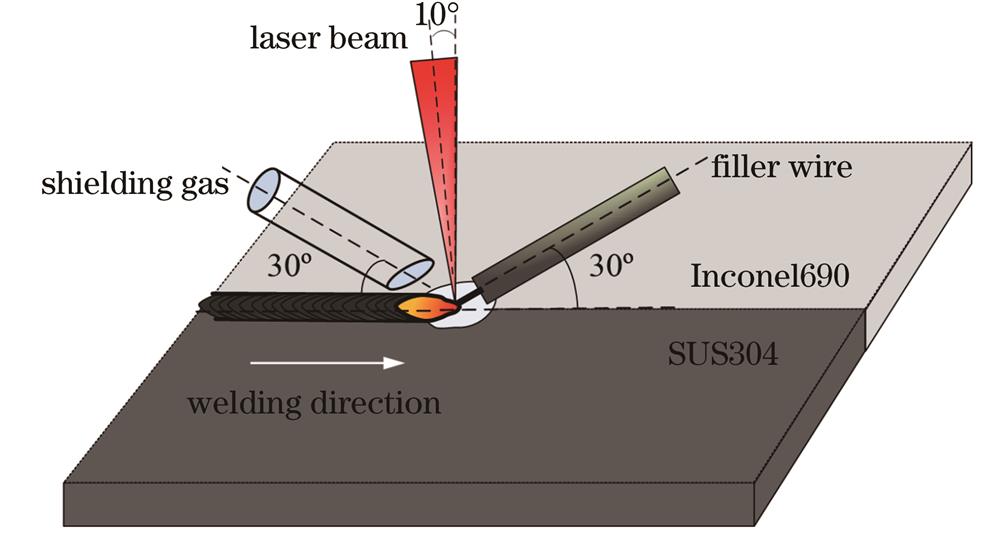
Fig. 1. Schematic diagram of laser filler wire welding
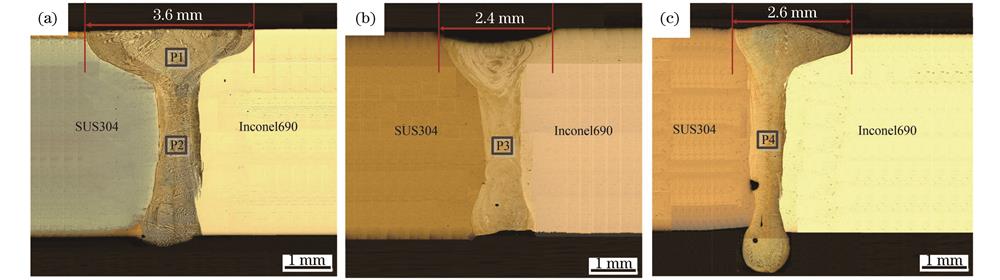
Fig. 2. Cross-sections of welded joints. (a) S1 (2.6 kJ/cm); (b) S2 (1.5 kJ/cm); (c) S3 (1.5 kJ/cm, filler wire)
Fig. 3. Microstructures of base metal and weld. (a) Inconel690 base metal; (b) fusion line;(c) center area of weld (enlarged image of P1 in Fig. 2); (d) S1 (enlarged image of P2 in Fig. 2); (e) S2 (enlarged image of P3 in Fig. 2); (f) S3 (enlarged image of P4 in Fig. 2)
Fig. 4. Element line scanning results of welded joints. (a) S2 (1.5 kJ/cm); (b) S3 (1.5 kJ/cm, filler wire)
Fig. 5. Element distribution of weld zone in S2 (1.5 kJ/cm)
Fig. 6. Morphology of white massive particles at different positions in S2 (1.5 kJ/cm). (a) weld zone close to Inconel690; (b) middle zone of weld; (c) weld zone close to SUS304
Fig. 7. Morphology of Cr-rich phase after adding filler wire
Fig. 8. XRD analysis of joint weld for S3 (1.5 kJ/cm, filler wire)
Fig. 9. Microhardness of joints with different parameters
Fig. 10. Tensile strength and elongation of joints with different parameters
Fig. 11. Tensile fracture morphology under different welding parameters. (a) Laser welding with high heat input;(b) laser filler wire welding with low heat input
|
Table 1. Composition (mass fraction) of base metal and welding wire
|
Table 2. Parameters of laser welding test
|
Table 3. Elemental compositions (mass fractions) of typical positions in Fig. 6
|
Table 4. Elemental compositions (mass fractions) of typical positions in Fig. 7

Set citation alerts for the article
Please enter your email address
© Copyright 2018-2021 | Chinese Laser Press. All Rights Reserved 沪ICP备15018463号-20