• Acta Optica Sinica
  • Vol. 43, Issue 12, 1201006 (2023)
Xiangrui Hu1, Faquan Li2, Houmao Wang3, Zihao Zhang1, Jianjun Guo1, Kuijun Wu1, and Weiwei He1、*
Author Affiliations
  • 1School of Physics and Electronic Information, Yantai University, Yantai 264005, Shandong, China
  • 2Innovation Academy for Precision Measurement Science and Technology, Chinese Academy of Sciences, Wuhan 430071, Hubei, China
  • 3National Space Science Center, Chinese Academy of Sciences, Beijing 100190, China
  • show less
    DOI: 10.3788/AOS221914 Cite this Article Set citation alerts
    Xiangrui Hu, Faquan Li, Houmao Wang, Zihao Zhang, Jianjun Guo, Kuijun Wu, Weiwei He. Retrieval and Verification of Mid-Upper Atmospheric Temperature from MIGHTI/ICON Satellite[J]. Acta Optica Sinica, 2023, 43(12): 1201006 Copy Citation Text show less
    O2-A band airglow radiation signal image measured by five spectral channels of MIGHTI
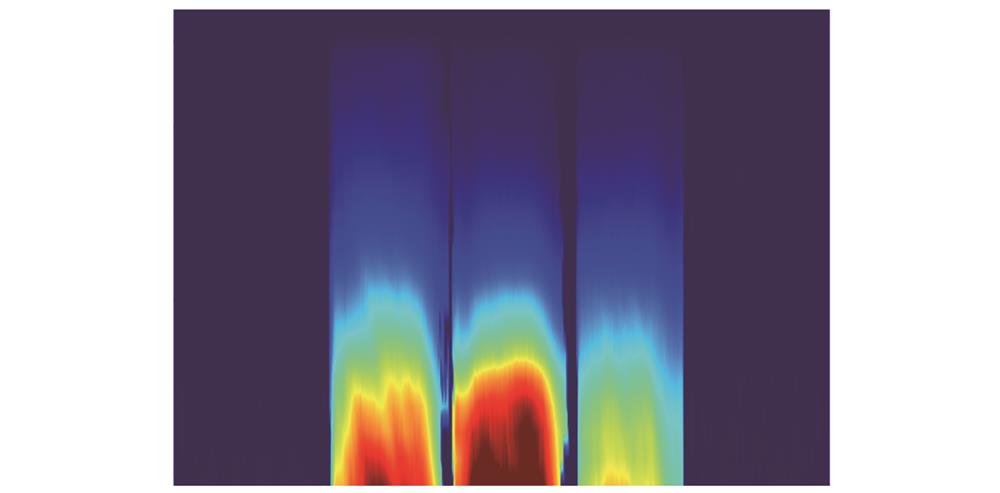
    Fig. 1. O2-A band airglow radiation signal image measured by five spectral channels of MIGHTI
    Temperature sensitivity of spectral characteristics of airglow radiation in O2-A band and filter transmission functions of B, C, and D sampling channels of MIGHTI
    Fig. 2. Temperature sensitivity of spectral characteristics of airglow radiation in O2-A band and filter transmission functions of B, C, and D sampling channels of MIGHTI
    Relationship between relative intensity and its ratio of B, C, and D sampling channels of MIGHTI and temperature. (a) Relationship between relative intensity and temperature of B, C, and D channels; (b) relationship between relative intensity ratio of B/C and D/C channel combinations and temperature
    Fig. 3. Relationship between relative intensity and its ratio of B, C, and D sampling channels of MIGHTI and temperature. (a) Relationship between relative intensity and temperature of B, C, and D channels; (b) relationship between relative intensity ratio of B/C and D/C channel combinations and temperature
    Relative radiance of path integral of O2-A band airglow measured by MIGHTI and relative intensity of target layer extracted by onion peeling algorithm. (a) Relative radiance of O2-A band airglow along the line of sight; (b) relative intensity of target layer for three signal channels B, C, and D
    Fig. 4. Relative radiance of path integral of O2-A band airglow measured by MIGHTI and relative intensity of target layer extracted by onion peeling algorithm. (a) Relative radiance of O2-A band airglow along the line of sight; (b) relative intensity of target layer for three signal channels B, C, and D
    Comparison of temperature profiles between MIGHTI and SABER at similar geographical locations. The error bar on MIGHTI line reflects the estimation error of the instrument and the retrieval process. (a) Temperature comparison between MIGHTI and SABER at close positions at 7:00 local time on January 1, 2021; (b) temperature comparison between MIGHTI and SABER at 6:00 local time on April 24, 2021
    Fig. 5. Comparison of temperature profiles between MIGHTI and SABER at similar geographical locations. The error bar on MIGHTI line reflects the estimation error of the instrument and the retrieval process. (a) Temperature comparison between MIGHTI and SABER at close positions at 7:00 local time on January 1, 2021; (b) temperature comparison between MIGHTI and SABER at 6:00 local time on April 24, 2021
    Temperature comparison between MIGHTI and atmospheric model at 12°S-42°N. (a) Temperature distribution of 12°S-42°N of mesosphere-lower thermosphere obtained by MIGHTI; (b) temperature distribution of 12°S-42°N of mesosphere-lower thermosphere obtained by atmospheric model
    Fig. 6. Temperature comparison between MIGHTI and atmospheric model at 12°S-42°N. (a) Temperature distribution of 12°S-42°N of mesosphere-lower thermosphere obtained by MIGHTI; (b) temperature distribution of 12°S-42°N of mesosphere-lower thermosphere obtained by atmospheric model
    Variation of the ratio of MIGHTI and SABER to corresponding atmospheric model temperature with altitude in four days in 2021
    Fig. 7. Variation of the ratio of MIGHTI and SABER to corresponding atmospheric model temperature with altitude in four days in 2021
    Temperature comparisons between the onion peeling algorithm and the optimization method. (a) Comparison of temperature profiles at 14:00 local time on January 8, 2021; (b) variation of relative temperature error with time from 8:00 to 18:00 local time on January 8, 2021
    Fig. 8. Temperature comparisons between the onion peeling algorithm and the optimization method. (a) Comparison of temperature profiles at 14:00 local time on January 8, 2021; (b) variation of relative temperature error with time from 8:00 to 18:00 local time on January 8, 2021
    Limb-viewing schematic of two field of view (FOV) in MIGHTI
    Fig. 9. Limb-viewing schematic of two field of view (FOV) in MIGHTI
    Temperature inversion results for two FOVs of MIGHTI
    Fig. 10. Temperature inversion results for two FOVs of MIGHTI
    Temperature error of MIGHTI
    Fig. 11. Temperature error of MIGHTI
    ParameterTarget sourceAltitude /km

    Vertical

    resolution /km

    Horizontal resolution /km
    Wind speed630.0 nm O atom red line airglow

    Daytime:90-170

    Night:210-300

    Daytime:5

    Night:30

    500
    557.7 nm O atom green line airglow

    Daytime:170-300

    Night:90-105

    Daytime:30

    Night:5

    Temperature762 nm O2-A band near-infrared airglow

    Daytime:90-140

    Night:90-108

    5500
    Table 1. MIGHTI scientific tasks and parameters[7]
    Xiangrui Hu, Faquan Li, Houmao Wang, Zihao Zhang, Jianjun Guo, Kuijun Wu, Weiwei He. Retrieval and Verification of Mid-Upper Atmospheric Temperature from MIGHTI/ICON Satellite[J]. Acta Optica Sinica, 2023, 43(12): 1201006
    Download Citation