• Laser & Optoelectronics Progress
  • Vol. 59, Issue 11, 1128001 (2022)
Hongke Wang, Decheng Xu*, Lei Lin, Yuwei Qi, and Guodong Zhang
Author Affiliations
  • Material Mechanics Institute, Suzhou Nuclear Power Research Institute, Suzhou 215004, Jiangsu , China
  • show less
    DOI: 10.3788/LOP202259.1128001 Cite this Article Set citation alerts
    Hongke Wang, Decheng Xu, Lei Lin, Yuwei Qi, Guodong Zhang. Design and Strain Characteristics of Trifarious Fiber Bragg Grating Strain Sensor[J]. Laser & Optoelectronics Progress, 2022, 59(11): 1128001 Copy Citation Text show less
    Structure of the FBG sensor
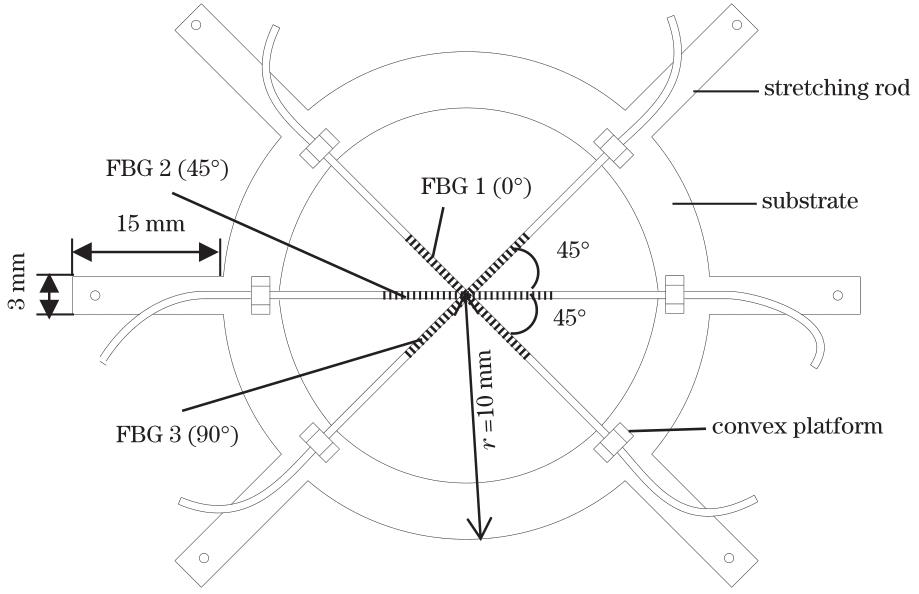
    Fig. 1. Structure of the FBG sensor
    Packaging process of trifarious FBG strain sensor. (a) Welding schematic diagram; (b) photo after encapsulation; (c) photo after calibration
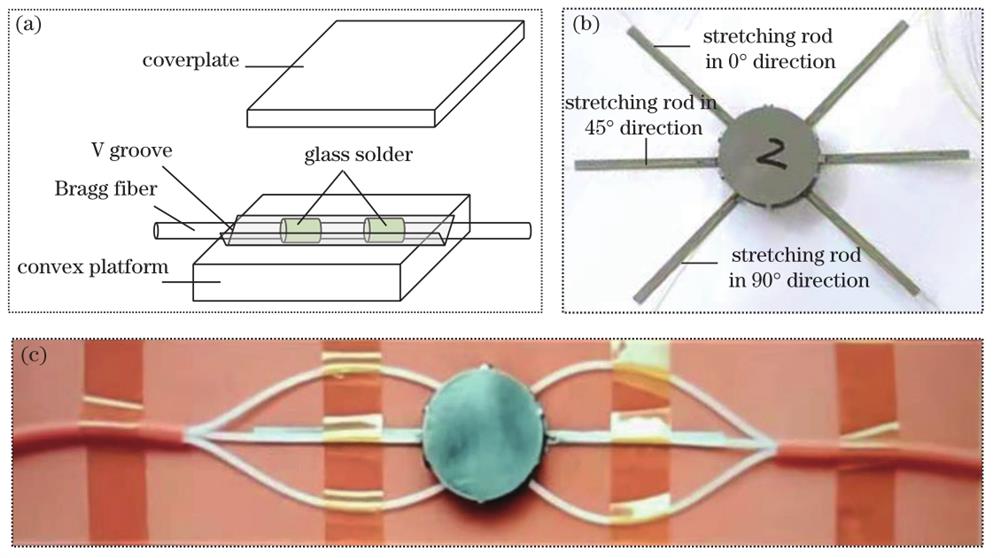
    Fig. 2. Packaging process of trifarious FBG strain sensor. (a) Welding schematic diagram; (b) photo after encapsulation; (c) photo after calibration
    Calibration of the sensor
    Fig. 3. Calibration of the sensor
    Schematic diagram of the experimental setup
    Fig. 4. Schematic diagram of the experimental setup
    Static test curves of the two sensors. (a) Time domain signal of resistance strain gauge; (b) time domain signal of FBG strain sensor
    Fig. 5. Static test curves of the two sensors. (a) Time domain signal of resistance strain gauge; (b) time domain signal of FBG strain sensor
    Sinusoidal sweep response curves of two sensors. (a) Time domain signal of strain gauge; (b) time domain signal of FBG strain sensor
    Fig. 6. Sinusoidal sweep response curves of two sensors. (a) Time domain signal of strain gauge; (b) time domain signal of FBG strain sensor
    Random vibration time domain signals of two sensors. (a) Time domain signal of strain gauge; (b) time domain signal of FBG strain sensor
    Fig. 7. Random vibration time domain signals of two sensors. (a) Time domain signal of strain gauge; (b) time domain signal of FBG strain sensor
    Power spectrum of random vibration signals of two sensors. (a) Strain gauge; (b) FBG strain sensor
    Fig. 8. Power spectrum of random vibration signals of two sensors. (a) Strain gauge; (b) FBG strain sensor
    ProcessParameter0°(FBG 1)45°(FBG 2)90°(FBG 3)
    Loadsensitivity /(pm·με-10.9521.2600.985
    R20.99940.99990.9999
    Unloadsensitivity /(pm·με-10.9571.2570.990
    R20.99990.99950.9996
    Average sensitivity /(pm·με-10.9551.2590.988
    Table 1. Calibration result of FBG sensor
    Frequency /Hz551106101220
    Spectrum values /[(m·s-22·Hz-10.011.001.000.01
    Table 2. Parameter settings of random vibration experiment
    CategoryFBG sensorResistance strain gauge
    F1-0°(FBG 1)F1-45°(FBG 2)F1-90°(FBG 3)S1-0°S1-45°S1-90°
    Maximum peak193.72279.59216.8463.5186.1680.46
    Minimum trough-186.39-160.44-170.16-50.67-163.62-74.30
    Table 3. Results of static test
    Hongke Wang, Decheng Xu, Lei Lin, Yuwei Qi, Guodong Zhang. Design and Strain Characteristics of Trifarious Fiber Bragg Grating Strain Sensor[J]. Laser & Optoelectronics Progress, 2022, 59(11): 1128001
    Download Citation