1State Key Laboratory for Mesoscopic Physics, Department of Physics, Peking University, Beijing 100871, China
2State Key Laboratory of Membrane Biology, School of Life Sciences, and Biomedical Pioneering Innovation Center (BIOPIC), Peking University, Beijing 100871, China
3School of Physics, Xi’an Jiaotong University, Xi’an 710049, China
4Collaborative Innovation Center of Extreme Optics, Shanxi University, Taiyuan 030006, China
5Peking University Yangtze Delta Institute of Optoelectronics, Nantong 226010, China
【AIGC One Sentence Reading】:A reflective light-sheet microscope using a mini-prism achieves isotropic 3D resolutions down to 300nm, enhancing conventional fluorescence microscopy performance.
【AIGC Short Abstract】:Light-sheet fluorescence microscopy, crucial in bio-imaging, faces challenges with limited 3D isotropic resolutions due to its perpendicular excitation and detection layout. We introduce a reflective light-sheet microscope using a mini-prism, enhancing resolution and isotropy. This design allows for isotropic 3D resolutions up to 300 nm without deconvolution, easily converting a standard fluorescence microscope to high-performance light-sheet microscopy.
Note: This section is automatically generated by AI . The website and platform operators shall not be liable for any commercial or legal consequences arising from your use of AI generated content on this website. Please be aware of this.
Abstract
Light-sheet fluorescence microscopy (LSFM) has played an important role in bio-imaging due to its advantages of high photon efficiency, fast speed, and long-term imaging capabilities. The perpendicular layout between LSFM excitation and detection often limits the 3D resolutions as well as their isotropy. Here, we report on a reflective type light-sheet microscope with a mini-prism used as an optical path reflector. The conventional high NA objectives can be used both in excitation and detection with this design. Isotropic resolutions in 3D down to 300 nm could be achieved without deconvolution. The proposed method also enables easy transform of a conventional fluorescence microscope to high performance light-sheet microscopy.
Author Presentation Playback
视频暂时无法播放,请稍后刷新重试 #007.4
00:00
00:00/01:11:14
弹幕
vr模式
超清
高清
流畅
自动
2x
1.5x
1.2x
1x
0.5x
字幕
模式
视频音频
线路
vr模式
裸眼眼镜
播放器
FlashHTML5
画中画
网页全屏
全屏
Version:v1.62.1
由酷播云提供服务
1. INTRODUCTION
Fluorescence microscopy [1] is typically evaluated based on four key parameters: temporal resolution, spatial resolution, signal-to-noise ratio (SNR), and imaging speed [2]. Light-sheet fluorescence microscopy (LSFM) selectively illuminates a plane in the biological sample [3], achieving the balance of the four aspects of fluorescence microscopy [4–7]. As a result, LSFM has become an ideal tool for three-dimensional (3D) imaging of live cells [8–13]. In LSFM, the thickness of the light sheet directly affects the slicing capability [14]. The primary challenge in LSFM is generating an ultra-thin light sheet for optical sectioning in order to improve both SNR and axial resolution [15–18].
The thickness of the light sheet is usually confined by the numerical aperture (NA) of the excitation objective. Traditionally, the perpendicular layout between LSFM excitation and detection puts many limits on the placement of the objectives and sample holders. For example, the dual-view inverted selective plane illumination microscope (diSPIM) [19] was designed to be user-friendly in terms of sample placement, but tilting the optical paths relative to the horizontal sample holder could introduce significant off-axis aberrations. This was especially true for higher NA beams, which limited the use of high NA objectives for generating thinner light sheets [20]. One solution to this problem was to use a single-objective lens for both excitation and detection, with the sample holder oriented orthogonally to the objective [21]. However, this approach has its own limitations: since the illumination and collection beams share the NA of the single objective, the NA was underutilized for exciting the light sheet. The oblique plane microscopy fully utilizes the NA to excite light sheet at an angle with respect to the optical axis; the fluorescence information is then detected and captured through remote-focusing with the same angle of inclination. This approach requires the use of three objectives and involves a complex optical setup. It also necessitates precise matching of the tilt angles and careful consideration of refractive index matching between the sample region and the detection objective lens focal region [22–24]. Another approach involved converting axial information into lateral information using a micromirror array [25]. Extracting axial information required a long working distance objective due to the large size of the micromirror array, which limited axial resolution to 2.4 μm. Alternative approaches included combining LSFM with a micro-reflector or using an atomic force microscopy (AFM) cantilever to reflect the light sheet by 90° into the sample [26–28]. It should be noticed that introducing reflective elements in the excitation beam path leads to the use of a long working distance objective lens. Objectives with long working distances tend to have lower NA, making it challenging to generate thin light-sheet excitation. Furthermore, with the reflective element in the excitation beam path, there is significant spherical aberration due to refractive index mismatch among the objectives, the reflector, and the sample, particularly in the cases of tight focusing with high NA objectives. The presence of spherical aberration further degrades the thickness of the light sheet. It therefore led to poor axial resolution. Additionally, these methods can be costly due to the need for a new AFM cantilever each time, and system tuning can be quite complicated.
In this paper, we present a new method for reflective type light-sheet microscopy (RTLIS) that is capable of achieving ultra-thin light-sheet excitation with a high signal-to-noise ratio (SNR) and axial resolution. RTLIS accomplishes this through several advantages. Different from previous efforts, by using a reflective mini-prism in the detection beam path, isotropic resolution can be achieved when the excitation and detection objectives are identical. An ultra-high NA objective lens (NA 1.4) can further be used for thinner light-sheet excitation, resulting in a thickness of 190 nm when using a 561 nm laser. Secondly, the use of a mini-prism enables the proposed scheme to be compatible with traditional transmission type fluorescence microscopes. It therefore spares the sophisticated sample mounting in conventional LSFM. We demonstrate these capabilities through fast 3D imaging of Drosophila Rh6 cells with dimensions of μμμ. The lateral resolution of the system was 309 nm, and the axial resolution was also 312 nm without deconvolution.
Sign up for Photonics Research TOC. Get the latest issue of Photonics Research delivered right to you!Sign up now
2. MAIN PRINCIPLE AND EXPERIMENTAL LAYOUT
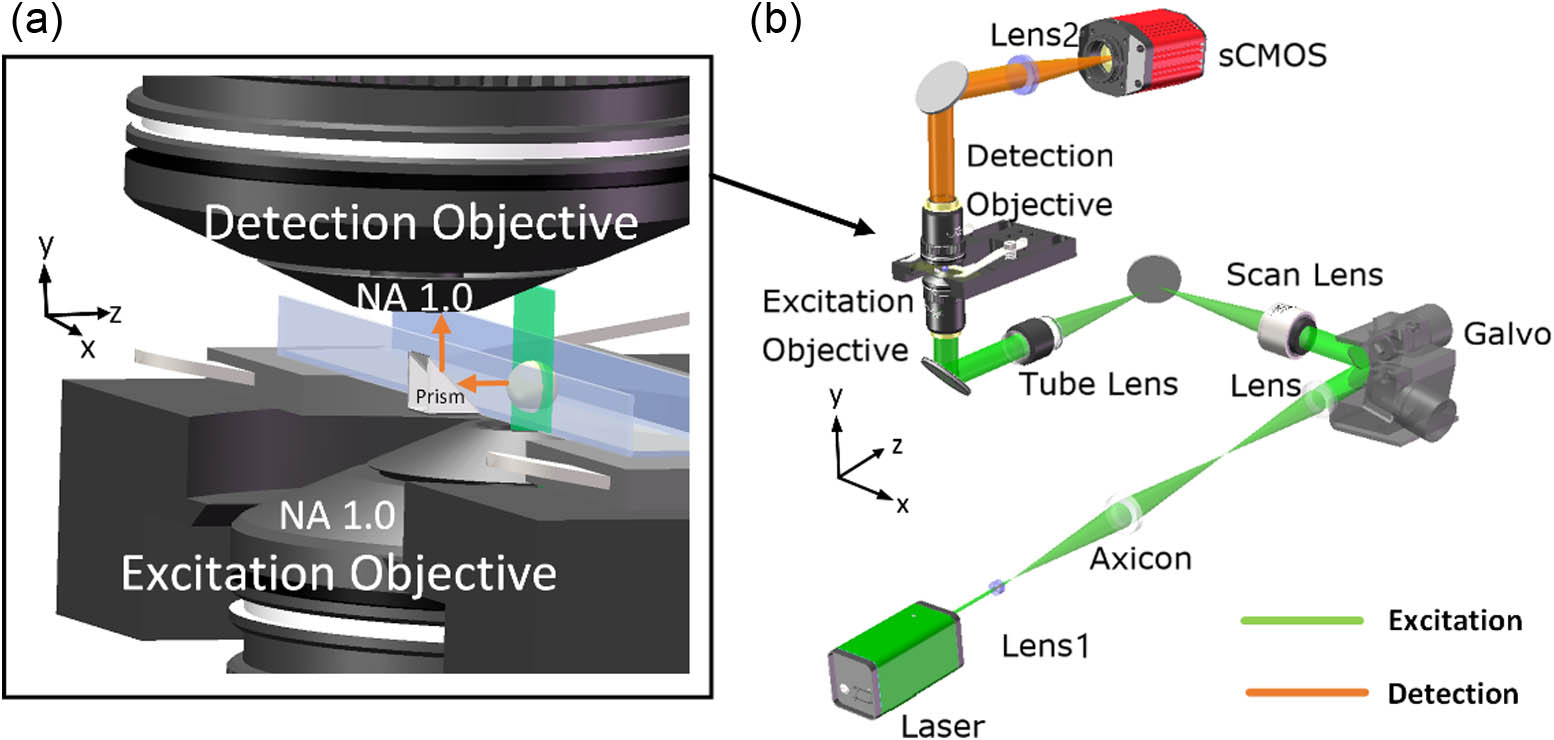
As shown in Fig. 1(a), a mini-prism mechanically mounted together with the sample chamber acts as the beam reflector, which essentially transforms a traditional transmission microscope into reflective LSFM. The mechanical design for the mini-prism-based sample compartment is discussed in Appendix A. These design considerations take into account the cover glass thickness adapted for objectives, matching with standard sample holders to minimize optical aberrations and ensure the stability of the glass plate. An ultra-thin light sheet then is generated by a high NA objective (NA 1.0), which selectively illuminates a single plane within the sample. The sample chamber is specially designed as a square slot () made of glass, with both the bottom and sides having a thickness of 0.17 mm. The fluorescence signals excited by the light sheet are reflected by a prism adjoining the glass sample chamber and then detected by the detection objective (NA 1.0). Using the identical objectives for both light sheet excitation and detection allows for isotropic resolution in all three dimensions. Additionally, the use of non-specifically designed objectives lowers experimental costs. The design of the glass chamber allows for a wide variety of samples to be used in experiments.
Figure 1.Design of RTLIS. (a) Diagram of mini-prism reflector that can be used in traditional inverted microscope configurations for light-sheet excitation and detection. (b) Schematic of RTLIS setup. Lens1, ; scan lens, ; tube lens, ; lens2, ; sCMOS: scientific complementary metal oxide semiconductor.
In our system, a 561 nm Gaussian beam (Coherent, OBIS CORE LS 561) is expanded and collimated by a lens (Olympus/, NA 0.13) before passing through an axicon lens (Thorlabs, AX252-A) to be transformed into a Bessel beam. The beam is then scanned along the X-axis to generate light-sheet illumination in the nominal object plane by galvo X (Thorlabs, GVS012, 2D). The excitation objective (Olympus, , water immersion, NA 1.0) focuses the light sheet onto the sample, projecting a square area of illumination that emits fluorescence signals. These signals are reflected by a mini prism and collected by the detection objective (Olympus, , water immersion, NA 1.0). After passing through a band-pass filter (Chroma, D580/20 mm), 3D imaging of the sample is acquired on a sensitive sCMOS camera (Hamamatsu, Flash4.0 V3) by synchronously moving the galvo Z along the Z-direction and a motorized translation stage (Newport, LTA-HL) along the Y-direction; the detection path [indicated by the orange beam in Fig. 1(b)] is placed on the motorized translation stage. The moving speed of the translation stage is 1 mm/s; when volumetric imaging was performed, the excitation light sheet was scanned at the step of 300 nm. Accordingly, the detection system was vertically translated at the same step, taking the time of 30 μs for each step. The camera exposure time was at the ms scale. Therefore, the primary limiting factor for the volumetric imaging speed is the camera exposure time. All motions, camera exposure, galvanometer deflection, and optical switching of the laser are synchronously timed and controlled by a DAQ (data acquisition system) (NI, 6259) (see Appendix B). The system control and data processing use a computer (Dell, T3630).
In the coordinate system as shown in Fig. 1(a), the Y-direction mentioned herein is the optical axis direction for excitation optics. In conventional fluorescence microscopy, the fast dynamics in the excitation optical axis direction is usually difficult to capture. In the proposed RTLIS, to obtain an axial plane image such as XY, only one frame imaging is needed, which is very important for samples with a dynamic axial distribution.
In the experiments, we first measured the optical performance of the setup. The point spread function (PSF) of this system was characterized by imaging 80 nm fluorescence beads. The deconvolution imaging results are shown in Figs. 2(a) and 2(b). The data are fitted by Gaussian function. The full-width at half-maximum (FWHM) values of the PSF along X are 290 nm and along Z are 310 nm. Figures 2(c) and 2(d) demonstrate the 3D isotropic resolution around 300 nm, while the raw imaging results are shown in Appendix D, in which the FWHM values of the PSF along X are 309 nm and along Z are 312 nm.
Figure 2.Characterization of the microscope. Representative PSF was obtained by imaging 80 nm fluorescence beads. Projections along XY and XZ are shown in (a) and (b). The Gauss fit curve of the line profiles of the PSF is shown in (c) and (d); the FWHM is 290 nm in X and 310 nm in Z, respectively.
Our proposed system allows for the direct use of a high NA objective lens for light-sheet excitation. However, whether a higher NA excitation objective necessarily results in a thinner light sheet remains an important topic of investigation. Light sheets can be divided into two categories based on the excitation beam: single-lobe light sheets and multi-lobe light sheets. In single-lobe light sheets, such as those generated by a Gaussian beam, a higher NA results in a smaller diameter of the focused spot but also an overly short length of the light sheet (see Appendix C). In contrast, multi-lobe light sheets, such as those generated by a Bessel beam, maintain an appropriate length with higher NA. A higher NA may introduce additional side lobes within the same field of view (FOV), sacrificing axial resolution and SNR and negating the benefits of using a higher NA excitation objective. We address this issue by simulating the beam used for light-sheet excitation and validating our simulation results experimentally by scanning gold nanoparticles.
The beam simulation is based on the beam propagation method (BPM). The BPM represents an analytical solution to the Helmholtz equation [29], as shown in Eq. (1). The accuracy of the simulation was validated [30]:
The basic idea of BPM is to divide the propagation path traveled by the beam in the Z-direction into parts with a small distance between adjacent parts. The light field distribution of each cross-section can be calculated from the light field of the previous cross-section so that the light field of each section can be obtained by the method of split-step calculation.
is the complex amplitude of the electric field at the coordinate vector , is the wavelength of light in a vacuum, and is the refractive index, composed of and . In the paraxial approximation, while the beam propagates forward along the Z-axis, the complex amplitude of the electric field can be expressed as Eq. (2): where is the amplitude at the entry of the slice. According to the idea of the split-step calculation of the beam propagation theory, the change in at each step is linear, the incident surface is defined as , and the exit surface is defined as of each slice. The iterative relationship for and can be expressed as Eq. (3):
During the propagation of light fields, the additional phase of angular spectrum diffraction in the frequency domain and the additional phase of non-uniform refractive index distribution in the spatial domain are mainly calculated. The angular spectrum diffraction in the frequency domain is solved by Fourier transformation (FT), and the iterative relationship shown in Eq. (4) is obtained:
Considering that the incident angle at high NA is much larger than the paraxial approximation, we apply the propagation equation under a large incident angle [31], as shown in Eq. (5):
Equation (5) is used to investigate the optical characteristics of the excited Bessel beam and scanning light sheet using a high NA objective. In the simulation, a , NA 1.0, water immersion objective is used. The entrance pupil of the objectives is set to be the cutoff frequency corresponding to the edge of the projection on its anterior focal plane. High frequency plane wave components beyond this edge do not pass through the objectives. Therefore, the image on the anterior focal plane of the objectives is set to be tangential to the projection edge in order to determine the NA of the objectives. Additionally, the spectral distribution of Bessel beams in the frequency domain is a ring. The spectral distribution of at the back focal plane of the objectives is set to form a ring distribution with an outer diameter of 6 mm and a thickness of 0.2 mm, and the corresponding NAs are 1.0 and 0.97, consistent with the experiment. After FT, the beam continues to propagate split-step in the Z-direction to obtain the Bessel beam under high NA focusing. The beam is scanned along the X-direction to obtain the corresponding optical field distribution of the light sheet. The sample environment used is a water-based solution, the refractive index of the medium is set to 1.33, and the wavelength of light in the medium is 561 nm.
The results of the simulation in Figs. 3(a)–3(d) and the results of the experiments in Figs. 3(e)–3(h) agree with each other well. According to the YZ distribution of a Bessel light sheet both in simulation results and experiment results as shown in Figs. 3(b) and 3(f), respectively, the Bessel light sheet still maintains a proper length of μ when NA is 1.0. The side lobe of the Bessel light sheet is distributed beyond 800 nm from the center, which can be seen in Figs. 3(a), 3(b), 3(e), and 3(f), and the intensity of the side lobe is 30% of the main lobe, which is shown in the normalized intensity distribution [inset of Figs. 3(a) and 3(e)]. The axial resolution and the optical sectioning in LSFM should be decided by the overlap of excitation (green) PSF and detection (blue) PSF [Fig. 3(i)]. The PSF of the detection path [] is characterized in Fig. 3(j). The PSF of the excitation path [] is shown in Figs. 3(f)–3(h), so the overall PSF [] can be written as
Figure 3.Simulation and experiment results of the characterization of the illumination beam for light-sheet excitation with 561 nm wavelength. (a)–(d) BPM simulation results of the Bessel beam: (a) XZ distribution with NA 1.0 water immersion objective of the Bessel beam; (b)–(d) YZ, XZ, and XY distribution of scanning Bessel light sheet with NA 1.0 water immersion objective, respectively. (e)–(h) Experimental results of the Bessel beam profiles obtained by scanning gold nanoparticle and measuring the scattering signal: (e) XZ distribution with NA 1.0 water immersion objective of the Bessel beam; (f)–(h) YZ, XZ, and XY distribution of scanning Bessel light sheet with NA 1.0 water immersion objective, respectively. (i) The overlap of excitation (green) and detection (blue) PSFs yields the system PSF. (j) PSF of NA 1.0 detection objective in XZ; (k) overall PSF of the light-sheet system. The color scale defines the normalized intensity of the system.
In the light-sheet system, the is the intensity distribution of the scanned light sheet [], so can be written as
The theoretical result and the experiment result of overall of the light-sheet system are shown in Fig. 3(k) and Fig. 2, respectively. The theoretical resolution of RTLIS is 290 nm in XY, and 270 nm in Z, when only the main lobe is considered. The experimental resolution of RTLIS is 290 nm in XY, and 310 nm in Z, so there is little impact brought by the side lobe, but the system also shows around 300 nm isotropic distribution in 3D without deconvolution and deep learning algorithms. The system design allows for the use of objectives with higher NA for light-sheet excitation, achieving higher axial resolution without sacrificing lateral resolution. At the same time, the system also allows for light sheet imaging with a Gaussian beam, further improving contrast, but at the expense of the FOV to some extent. Detailed experiments and simulations of the Gaussian beam light sheet are discussed in Appendix C.
4. EXPERIMENTAL RESULTS
Fluorescent microspheres with diameters of 2, 5, and 10 μm are used as our imaging samples. The microspheres are mixed with agarose solution and injected into the glass chamber. Figure 4(a) shows the sectioned fluorescence images of one cluster of three microspheres. Figure 4(b) shows the optical sections of 10 μm microspheres at different depths. Figure 4(c) shows the fluorescence image of a 2 μm microsphere. Figures 4(d)–4(f) show the 3D views of two microspheres.
Figure 4.Imaging results of fluorescent microspheres. (a) Imaging result of the 10 μm microspheres; (b) optical sections of 10 μm microspheres at different depths; (c) imaging result of the 2 μm microsphere; (d) imaging result of two fluorescent microspheres in XY-profile with diameters of 10 and 5 μm; (e) imaging result of two fluorescent microspheres in XZ-profile with diameters of 10 and 5 μm; (f) imaging result of two fluorescent microspheres in YZ-profile with diameters of 10 and 5 μm.
The Rh6 cell of the Drosophila eye is used for the bio-cellular imaging. The Drosophila eye provides a powerful system to study cell-fate determinations: it develops from a flat epithelium into a complex three-dimensional structure of multiple cell types in less than a week [32]. In the Drosophila compound eye, each of the 800 ommatidia is a single optical unit containing photoreceptor cells (PRs). The eight PRs form widely expanded membrane structures, rhabdomeres, which contain the photosensitive rhodopsin (Rh). The discovery of the three-dimensional structure of Rh6 cells in adult Drosophila eye has significant implications for the study of gene expression. RFP expression in Rh6 cells of living flies was assessed by neutralizing the cornea using water immersion. This feature is well-suited for fluorescence imaging with excitation wavelength at 561 nm. Using RTLIS, we achieved simultaneous 3D volume imaging of the Rh6 cell throughout a whole sample at a speed of 100 frames per second. Figure 5 shows the 3D views of the fluorescence images of the Rh6 cells. The volume size is μμμ.
Figure 5.Imaging results of Drosophila eye’s Rh6 cells. (a) Cross-sectional slices (XY) of the Rh6 cells; (b) cross-sectional slices (XZ) of the Rh6 cells; (c) cross-sectional slices (YZ) of the Rh6 cells.
In summary, we have demonstrated reflected ultrathin light-sheet microscopy with isotropic 3D resolution. With this configuration, a high NA objective lens can be fully utilized for both excitation and detection, improving spatial resolution, especially axial resolution, achieving 300 nm isotropic resolution in 3D. Furthermore, higher axial resolution can be achieved with a higher NA excitation objective (see Appendix C). Additionally, the ingeniously designed glass chamber allows for easily transforming a conventional inverted microscope into light-sheet microscopy, potentially making it the simplest LSFM setup. The proposed scheme can also be easily integrated with other imaging modalities, such as super-resolution microscopy for promising biomedical applications. It should be noticed that employing high NA excitation objectives also leads to a reduced axial extent of the beam, even when using Bessel beams as reported in current work. This trade-off necessitates sacrificing the field of view in order to achieve thinner light sheets. To address this limitation, one can integrate axially swept light-sheet microscopy [33,34], thereby enabling high resolution imaging over a larger field of view.
APPENDIX A
The sample is placed in a glass chamber with dimensions of and a thickness of 170 μm, which is the same as a conventional cover glass [Fig. 6(a)]. The glass chamber can be designed with either a cap or open top. A mini-prism is positioned in the square hole [Fig. 6(b)] with dimensions of , placing strict restrictions on the orientation and spatial position of the prism. The prism is located close to the glass chamber. The slide [Fig. 6(c)] has the same size as a conventional glass slide (). The hole in the center of the slide, with a diameter of 24 mm, provides easy access to the sample with the excitation objective and is suitable for most objectives. The prism will limit the obtainable detection NA. The experiments were conducted using an Olympus NA 1.0 water immersion objective. The samples were placed in agar, with a refractive index of 1.333 for both water and agar. The NA is given by , where is the refractive index and is the half-angle of the cone of light entering the objective. In this environment, the maximum NA of the detection objective utilized by the 45° prism is 0.943. The prism, excitation objective, and detection objective are not fixed. They are placed on different three-dimensional translation stages, allowing for individual position adjustment. The FOV of the detection system was approximately 440 μm with the detection objective lens of . The working distance of the detection objective lens (NA 1.0) was 2 mm. Therefore, the sampling space in both lateral and longitudinal planes is determined only by the excitation light sheet. The arrangement of the sample holder, sample stage, and two objectives in the actual experiment is shown in Fig. 6(e). The cutout on one side of the sample holder is for the convenience of checking the position of the prism during the system setup, the glass chamber in the sample holder is a cap, and top right of the image is an open top glass chamber. The sample holder can be matched with any sample stage, providing a natural vertical perspective and simplifying the complexity of light-sheet microscopy systems.
Figure 6.Design and physical drawings of sample chamber. (a) Open-top glass chamber for biological sample; (b) mini-prism holder; (c) design of the slide; (d) assembled sample holder; (e) photograph of the sample holder with objectives.
The synchronous timing control diagram of the RTLIS electronics is shown in Fig. 7. In the first row, the driving signal of the galvo X is a triangular waveform with a duty cycle of 90%; 10% is used to return to the initial position, and the scan range of the galvo X determines the width of the light sheet; in the second row, the camera is triggered by the rising edge of the TTL signal, and there is a settle time between trigger and exposure; in the third row, the laser is controlled by the camera trigger, and it only emits light when the camera is exposing, to minimize photodamage to the sample; in the fourth row, the driving signal of the galvo Z is direct current, used to move the light sheet in Z direction, achieving a section of the sample; in the last row, the motorized translation stage and the galvo Z are synchronously moved, to ensure that the signal detected by the camera is always on the plane where the light sheet is located. With synchronous timing control, RTLIS can achieve a speed of 100 frames per second, making it suitable for imaging dynamic processes. In this study, Visualization 1 is the imaging results of floating fluorescent micro-spheres. The experimental procedure involved preparing a solution of fluorescent beads by adding 1% of 10 μm fluorescent beads to an aqueous solution. The solution was then injected into a chamber, and a slight disturbance was applied to the platform holding the sample. Subsequently, rapid imaging of the sample was conducted at a speed of 100 frames per second, allowing for detailed analysis of the sample’s motion process.
Figure 7.Synchronous timing control diagram of the RTLIS electronics. The sCMOS camera and the galvo signals (X, Z) are done via a National Instruments DAQ, whereas the laser intensity control is realized by the sCMOS camera trigger; the motorized translation stage and the DAQ are both connected to the imaging computer.
The thickness has been discussed in Section 2, and the length of the light sheet is equally important. In the single-lobe light sheet, just like the Gaussian beam, the thickness is defined by the waist radius of the beam (), and the length is defined by the Rayleigh distance (); the relationship between the thickness and the length could be given as
The is dependent on the NA of the excitation objectives. The higher NA brings smaller , and the length has squared decay with , so the field of view (FOV) will be seriously limited by the high NA of the excitation objectives; as shown in Figs. 8(l) and 8(p), the length of the scanned Gaussian light sheet is just 1.5 μm when NA is 1.4, the wavelength of the excitation beam is 561 nm, and refractive index is 1.33. The wider FOV brings a thicker light sheet with a Gaussian beam.
Figure 8.BPM simulation results of the characterization of the illumination beam and scanned light sheet with 561 nm wavelength. (a)–(d) Results of the Bessel beam with NA 1.0 excitation objective: (a) XZ distribution of the Bessel beam; (b)–(d) YZ, XZ, and XY distribution of scanning Bessel light sheet, respectively. (e)–(h) Results of the Bessel beam with NA 1.4 excitation objective: (e) XZ distribution of the Bessel beam; (f)–(h) YZ, XZ, and XY distribution of scanning Bessel light sheet, respectively. (i)–(l) Results of the Gaussian beam with NA 1.0 excitation objective: (i) XZ distribution of the Gaussian beam; (j)–(l) YZ, XZ, and XY distribution of scanning Gaussian light sheet, respectively. (m)–(p) Results of the Gaussian beam with NA 1.4 excitation objective: (m) XZ of the Gaussian beam; (n)–(p) YZ, XZ, and XY distribution of scanning Gaussian light sheet, respectively. The color scale defines the normalized intensity of the system.
Figure 9.Beam profile measurements by scanning gold nanoparticle and detecting the scattering with NA 1.4 excitation oil immersion objectives. (a)–(d) Distribution of the Bessel light sheet: (a) XZ distribution of the Bessel beam; (b)–(d) YZ, XZ, and XY distribution of scanning Bessel light sheet, respectively. (e)–(h) Distribution of the Gaussian light sheet: (e) XZ distribution of the Gaussian beam; (f)–(h) YZ, XZ, and XY distribution of scanning Gaussian light sheet, respectively. The color scale defines the normalized intensity of the system.
In RTLIS, a wider selection of objectives can be used for light-sheet excitation. In our experiment, we used a commonly used objective (Olympus, , NA 1.4, oil immersion) to validate this performance. Figure 9 shows the characterization of Gaussian and Bessel beams with the NA 1.4 objectives in experiments. The main lobe of the Bessel beam is 190 nm and its length is 7 μm, while all other conditions are the same as for the Gaussian beam. This means that the system has higher optical sectioning capacity when isotropic distribution is not required. However, if the PSF of the detection system in the axial direction is poor, the side lobe of the Bessel beam cannot be ignored, and ultrahigh axial resolution and SNR are required, then a Gaussian light sheet with a high NA excitation objective may be the best choice.
APPENDIX D
The experimental results for resolution calibration using 80 nm fluorescent beads are presented in Fig. 10, showing both the raw data and deconvolution results. The first row is the raw data, while the second row displays the deconvolution results. The deconvolution process demonstrates potential enhancement in XY resolution, while exhibiting negligible impact in the Z-direction. That is, the lateral resolution is defined by the detection system, while the resolution in axial direction is defined by the thickness of light-sheet in RTLIS.
Figure 10.Experimental results for resolution calibration using 80 nm fluorescent beads. The first row represents the raw data, while the second row displays the deconvolution results. The scale bar is 500 nm.
Figure 11.Three-dimensional experimental results for 10 and 5 μm fluorescent beads. The first row represents the raw data, while the second row displays the deconvolution results. The scale bar is 7 μm.
A typical light-sheet microscopy system consists of two optical paths: the excitation path, which generates the light sheet, and the detection path, which captures the fluorescent information from the illuminated region. Currently, all existing reflective light-sheet microscopy techniques utilize a reflective element in the excitation path, which leads to the use of a long working distance objective lens. An objective lens with long working distances tends to have a lower numerical aperture (NA), making it challenging to generate a thin light sheet. Furthermore, with the reflective element in the excitation beam path, there is significant spherical aberration due to refractive index mismatch among the objective, the reflector, and the sample, particularly in the cases of tight focusing with high NA objectives. The presence of spherical aberration further degrades the thickness of the light sheet. Therefore, placing reflective elements in excitation paths limits the optical sectioning capability of the light sheet system and fails to provide highly resolved, three-dimensional isotropic imaging results.
Our work is different compared to the previous efforts. With a reflective element in the detection beam path, there are no limitations on the use of a high NA objective lens for the excitation light sheet. Moreover, by using a high NA immersion objective lens, the index mismatch in the excitation path can be minimized, and consequently the excitation spherical aberration can be reduced. The detailed comparison is shown in Table 1. The reflective excitation by AFM is the work proposed by Gebhardt et al. [26] and the reflective excitation by a prism is the work proposed by Greiss et al. [28]; the reflective detection by a prism is our work.
Comparison among Reflected Light Sheets
Reflective Excitation by AFM
Reflective Excitation by Prism
Reflective Detection by Prism (Current Work)
NA used for excitation
0.8
0.95
1.0/1.4
Wavelength of excitation light
405 nm
488 nm
561 nm
Best thickness reported in literature
400 nm
190 nm with 1.4 NA, 300 nm with 1.0 NA
Light-sheet thickness demonstrated in actual experiments
 AI Video Guide
  AI Picture Guide
 AI One Sentence