• Laser & Optoelectronics Progress
  • Vol. 60, Issue 1, 0107003 (2023)
Yu Wang, Tengfei Wu*, Qiang Zhou, Hui Zhao, and Jigui Zhu
Author Affiliations
  • State Key Laboratory of Precision Measurement Technology and Instrument, Tianjin University, Tianjin 300072, China
  • show less
    DOI: 10.3788/LOP212911 Cite this Article Set citation alerts
    Yu Wang, Tengfei Wu, Qiang Zhou, Hui Zhao, Jigui Zhu. Fast Acquisition and Processing Method of Optical Frequency Scanning Interferometry Ranging Signal[J]. Laser & Optoelectronics Progress, 2023, 60(1): 0107003 Copy Citation Text show less
    Diagram of FSI ranging system
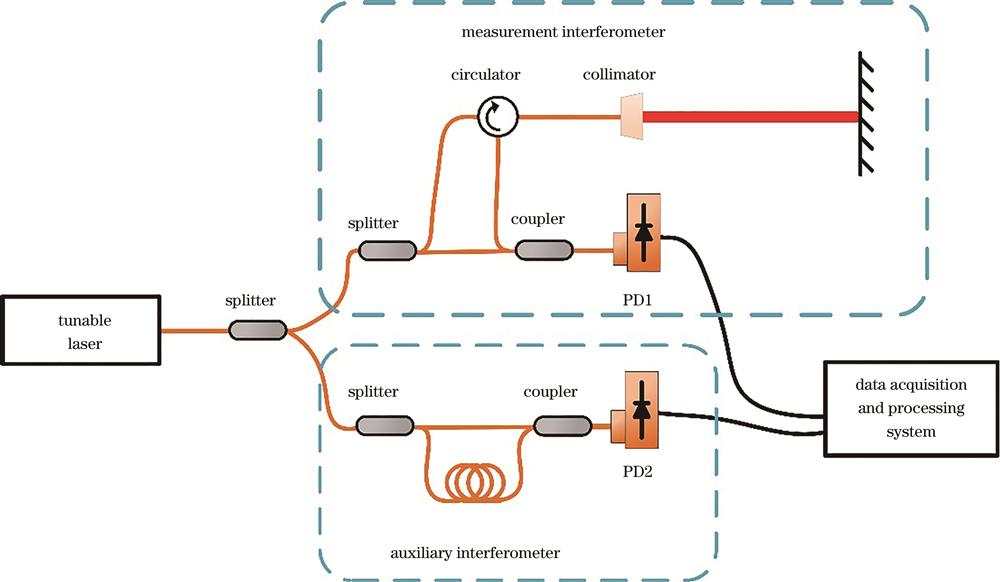
    Fig. 1. Diagram of FSI ranging system
    Data processing process
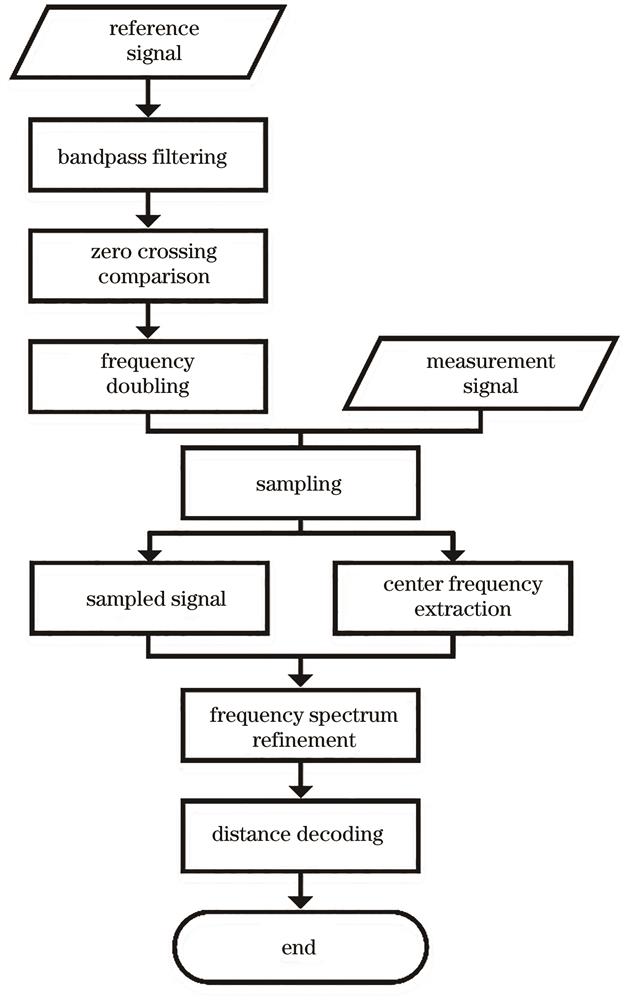
    Fig. 2. Data processing process
    Diagram of equal optical frequency sampling. (a) Frequency-swept auxiliary interferometer signal; (b) rectified and frequency-doubled clock signal is used to resample the signal; (c) frequency-swept measuring interferometer signal; (d) final equal optical frequency interval sampling signal
    Fig. 3. Diagram of equal optical frequency sampling. (a) Frequency-swept auxiliary interferometer signal; (b) rectified and frequency-doubled clock signal is used to resample the signal; (c) frequency-swept measuring interferometer signal; (d) final equal optical frequency interval sampling signal
    Diagram of extracting center frequency of the refined spectrum based on SFFT
    Fig. 4. Diagram of extracting center frequency of the refined spectrum based on SFFT
    Process of refining spectrum of the resampled signal based on ZFFT
    Fig. 5. Process of refining spectrum of the resampled signal based on ZFFT
    Schematic diagram of the experimental device
    Fig. 6. Schematic diagram of the experimental device
    Experimental device. (a) Device for comparing the distance; (b) experimental optical beam path; (c) device for hardware resampling
    Fig. 7. Experimental device. (a) Device for comparing the distance; (b) experimental optical beam path; (c) device for hardware resampling
    Effect of equal optical frequency sampling. (a) Spectrum of the signal without resampling; (b) software resampling and hardware resampling as well as their zoom-in spectra
    Fig. 8. Effect of equal optical frequency sampling. (a) Spectrum of the signal without resampling; (b) software resampling and hardware resampling as well as their zoom-in spectra
    Comparison of spectra of FFT and SFFT with different sparsity degrees. (a) FFT spectrum; SFFT spectra with (b) k = 50, (c) k = 100, and (d) k = 200
    Fig. 9. Comparison of spectra of FFT and SFFT with different sparsity degrees. (a) FFT spectrum; SFFT spectra with (b) k = 50, (c) k = 100, and (d) k = 200
    Computing time of FFT and SFFT with different sparsity degrees
    Fig. 10. Computing time of FFT and SFFT with different sparsity degrees
    CZT spectrum and ZFFT spectrum as well as their zoom-in spectra
    Fig. 11. CZT spectrum and ZFFT spectrum as well as their zoom-in spectra
    Ranging residuals
    Fig. 12. Ranging residuals
    AlgorithmPretreatment time /sSpectrum refinement time /sTotal time /s

    FFT+CZT

    SFFT+ZFFT

    0.2361

    0.0365

    3.0211

    0.1298

    3.2572

    0.1663

    Table 1. Running time of different algorithms
    Yu Wang, Tengfei Wu, Qiang Zhou, Hui Zhao, Jigui Zhu. Fast Acquisition and Processing Method of Optical Frequency Scanning Interferometry Ranging Signal[J]. Laser & Optoelectronics Progress, 2023, 60(1): 0107003
    Download Citation