• Chinese Optics Letters
  • Vol. 20, Issue 8, 081701 (2022)
Daoqian Yang1、2, Zhongjiang Chen3、*, and Da Xing1、2
Author Affiliations
  • 1MOE Key Laboratory of Laser Life Science & Institute of Laser Life Science, College of Biophotonics, South China Normal University, Guangzhou 510631, China
  • 2Guangdong Provincial Key Laboratory of Laser Life Science, College of Biophotonics, South China Normal University, Guangzhou 510631, China
  • 3Department of Ophthalmology and Optometry, School of Medical Technology and Engineering, Fujian Medical University, Fuzhou 350004, China
  • show less
    DOI: 10.3788/COL202220.081701 Cite this Article Set citation alerts
    Daoqian Yang, Zhongjiang Chen, Da Xing. A novel needle probe for deeper photoacoustic viscoelasticity measurement[J]. Chinese Optics Letters, 2022, 20(8): 081701 Copy Citation Text show less
    (a) Diagram of the optical phase difference oscillation process induced by PA excitation. ΔΦ is the optical phase difference oscillation curve at the (x, z) position within the sample. The green and red arrows represent excitation and detection lights, respectively. (b) Extraction of viscosity-elasticity ratio at the (x, z) point.
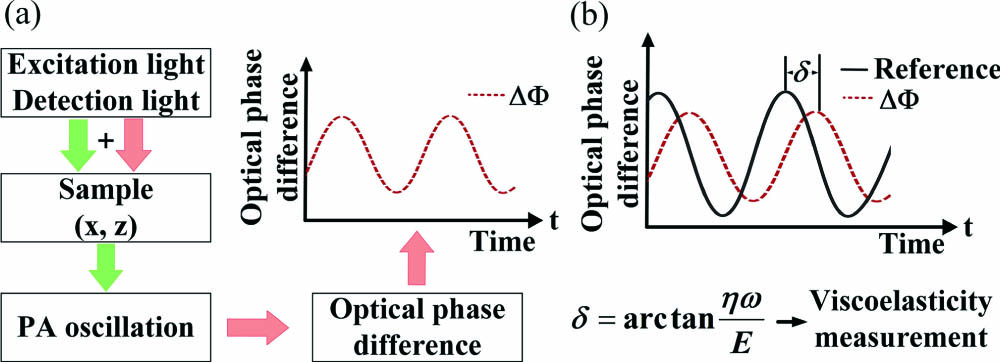
    Fig. 1. (a) Diagram of the optical phase difference oscillation process induced by PA excitation. ΔΦ is the optical phase difference oscillation curve at the (x, z) position within the sample. The green and red arrows represent excitation and detection lights, respectively. (b) Extraction of viscosity-elasticity ratio at the (x, z) point.
    (a) Schematic design of the needle probe. GRIN lens, gradient-index rod lens; SMF, single-mode fiber. (b) Picture of the assembled 0.7 mm needle probe with the side window. (c) Layout of the experimental setup. O1–O4, objective lenses; C, chopper; WDM, wavelength division multiplexer; PC1, PC2, fiber polarization controllers; FC, fiber coupler; C1, collimator; M, mirror; DAQ, data acquisition system. (d) Measured phase histogram of the static reflector of the SDLCI system with standard deviation σ = 0.0091 rad.
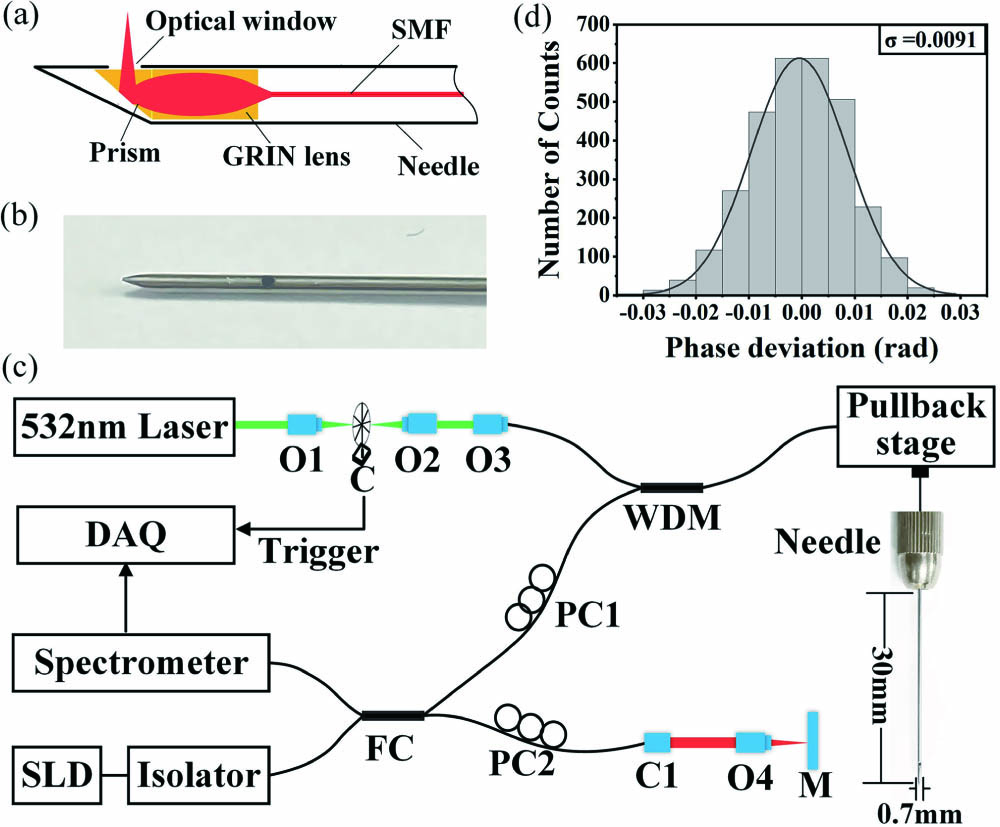
    Fig. 2. (a) Schematic design of the needle probe. GRIN lens, gradient-index rod lens; SMF, single-mode fiber. (b) Picture of the assembled 0.7 mm needle probe with the side window. (c) Layout of the experimental setup. O1–O4, objective lenses; C, chopper; WDM, wavelength division multiplexer; PC1, PC2, fiber polarization controllers; FC, fiber coupler; C1, collimator; M, mirror; DAQ, data acquisition system. (d) Measured phase histogram of the static reflector of the SDLCI system with standard deviation σ = 0.0091 rad.
    (a) Schematic of gelatin phantoms. (b) Three optical phase difference oscillation curves at the three black arrows marked in (a). (c) Distribution of mechanical phase delays along the needle insertion path. M, the average of mechanical phase delay. (d) Comparison of trends between internal friction angle obtained with the rheometer and mechanical phase delay measured with the PA needle for phantoms.
    Fig. 3. (a) Schematic of gelatin phantoms. (b) Three optical phase difference oscillation curves at the three black arrows marked in (a). (c) Distribution of mechanical phase delays along the needle insertion path. M, the average of mechanical phase delay. (d) Comparison of trends between internal friction angle obtained with the rheometer and mechanical phase delay measured with the PA needle for phantoms.
    (a) Distribution of mechanical phase delays along the needle insertion path. M, the average of the mechanical phase delay. (b) Comparison of trends between the internal friction angle obtained by the rheometer and the mechanical phase delay measured by the PA needle for muscle and myocardium of porcine.
    Fig. 4. (a) Distribution of mechanical phase delays along the needle insertion path. M, the average of the mechanical phase delay. (b) Comparison of trends between the internal friction angle obtained by the rheometer and the mechanical phase delay measured by the PA needle for muscle and myocardium of porcine.
    (a) Sonogram captured with an ultrasound-guided needle in mouse tissue. (b) Distribution of mechanical phase delays along the needle insertion path. M, the average of mechanical phase delay. (c) Comparison of trends between the internal friction angle obtained with rheometer and the mechanical phase delay measured with the PA needle for normal tissue and tumor.
    Fig. 5. (a) Sonogram captured with an ultrasound-guided needle in mouse tissue. (b) Distribution of mechanical phase delays along the needle insertion path. M, the average of mechanical phase delay. (c) Comparison of trends between the internal friction angle obtained with rheometer and the mechanical phase delay measured with the PA needle for normal tissue and tumor.
    Daoqian Yang, Zhongjiang Chen, Da Xing. A novel needle probe for deeper photoacoustic viscoelasticity measurement[J]. Chinese Optics Letters, 2022, 20(8): 081701
    Download Citation