1State Key Laboratory of Information Photonics and Optical Communications, School of Information and Communication Engineering, Beijing University of Posts and Telecommunications, Beijing 100876, China
2Beijing Key Laboratory of Intelligent Telecommunication Software and Multimedia, Beijing University of Posts and Telecommunications, Beijing 100876, China
3Institute of Electromagnetics and Acoustics and Fujian Provincial Key Laboratory of Electromagnetic Wave Science and Detection Technology, Xiamen University, Xiamen 361005, China
4Shenzhen Research Institute of Xiamen University, Shenzhen 518000, China
5School of Artificial Intelligence, Beijing Normal University, Beijing 100875, China
Whispering gallery mode (WGM) microcavities provide increasing opportunities for precision measurement due to their ultrahigh sensitivity, compact size, and fast response. However, the conventional WGM sensors rely on monitoring the changes of a single mode, and the abundant sensing information in WGM transmission spectra has not been fully utilized. Here, empowered by machine learning (ML), we propose and demonstrate an ergodic spectra sensing method in an optofluidic microcavity for high-precision pressure measurement. The developed ML method realizes the analysis of the full features of optical spectra. The prediction accuracy of 99.97% is obtained with the average error as low as 0.32 kPa in the pressure range of 100 kPa via the training and testing stages. We further achieve the real-time readout of arbitrary unknown pressure within the range of measurement, and a prediction accuracy of 99.51% is obtained. Moreover, we demonstrate that the ergodic spectra sensing accuracy is higher than that of simply extracting resonating modes’ wavelength. With the high sensitivity and prediction accuracy, this work opens up a new avenue for integrated intelligent optical sensing.
1. INTRODUCTION
Optical microcavities have attracted increasing attention in high-precision optical detection with the merits of ultrahigh sensitivity, miniature size, and fast response [1–9]. In particular, whispering gallery mode (WGM) resonators with high quality factors (-factors) and small mode volume can prominently enhance the light–matter interaction, resulting in a significant improvement of detection sensitivity [10–22]. For example, WGM resonators have achieved the detection of single molecules and even single ions through surface plasmonic enhancement, laser mode locking, and photo-spring effect [23–28]. Despite their superior sensitivities, the conventional optical platforms rely on monitoring a single particular mode, which significantly limits the dynamic detection range. In contrast, the multiple resonant modes in a WGM microcavity exhibit different responses to a target, providing abundant sensing information. By merging these sensing modalities, the multimode detection has a larger dynamic range with much less uncertainty than that of single-mode sensing [29].
However, the conventional WGM transmission spectra tend to exhibit high spectral density; for example, within the 1 nm spectral range, the resonant mode number of a microbubble resonator (MBR) is up to 305 [29]. It is a great challenge to manually analyze the massive resonant modes and establish the relationship between the responses of various WGMs and unknown targets. Machine learning (ML) is able to identify the entire features of a full spectrum on its own. As a data-driven analytical technology, it can automatically search for valid information from large data sets to reveal the mechanisms behind the data, thereby establishing a mapping relationship between the input data and unknown target parameters [30–34]. Recently, ML has been adopted in multimode sensing based on optical microcavities [35–37]. For example, by combining the artificial neural network model, Lu et al. have achieved the detection of voltage by extracting the transmission depth of multimodes, and the detection limit was 6.7% lower than that of single-mode sensing [35]. Indeed, the other features of multimode spectra, such as resonant wavelength, resonant mode number, mode spacing, and mode linewidth, can also be convoluted with effective sensing information. The extraction of an overall pattern of spectra is able to fully exploit valid information, which provides increasing opportunities for high-accuracy detection.
In this work, we propose an ergodic spectra sensing method in a WGM resonator empowered via ML. It considers the global features of spectra, which enables the full use of spectral information by combining the ML method, thereby improving sensitivity. The sensing systems realize the high-precision readout of the actual value of unknown target parameters. As a proof of principle, an internal aerostatic pressure sensing experiment is carried out by using a high -factor () MBR. A fully connected multilayer perceptron (MLP) neural network is selected to derive the spectral features to achieve the precise readout of actual pressure via the training and testing stages. The obtained prediction accuracy is 99.97%, while the average error is 0.32 kPa in the pressure range of 100 kPa. Within the measurement range, the prediction of arbitrary target pressure with an accuracy of 99.51% is achieved. Furthermore, the prediction accuracy of ergodic spectra sensing is 11.51% higher than that of simply extracting resonating modes’ wavelength. This work exhibits the ability of high-precision measurement and provides more degrees of freedom, which offers the potential for multiparameter sensing in a single platform.
Sign up for Photonics Research TOC. Get the latest issue of Photonics Research delivered right to you!Sign up now
2. FABRICATION AND CHARACTERIZATION
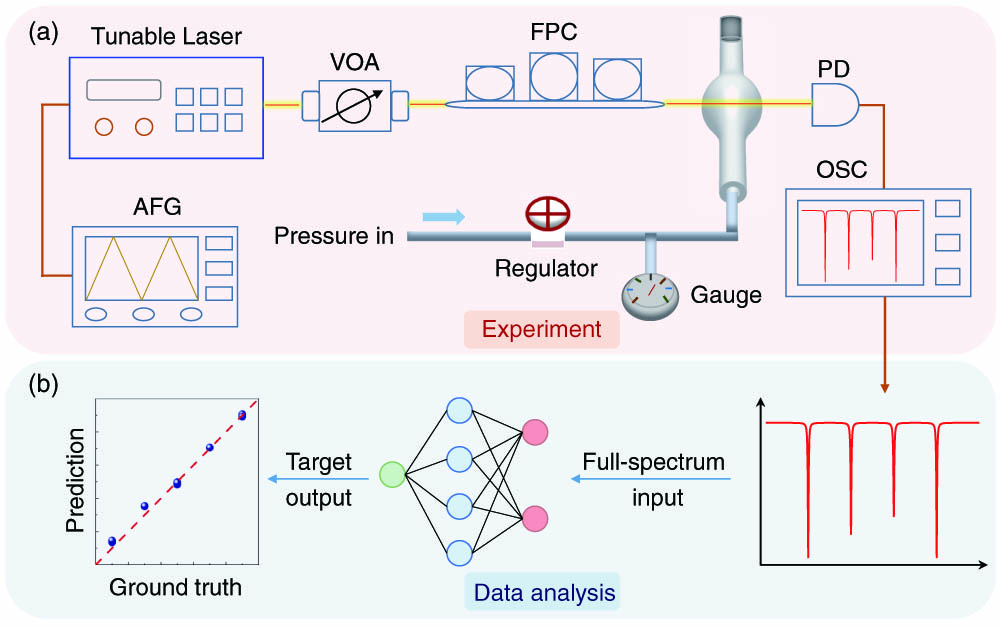
Figure 1(a) shows the experimental setup for internal aerostatic pressure measurement. A tunable laser at is adopted to excite the resonant modes of MBR via a tapered fiber. The wavelength of the laser is finely scanned by a 50 Hz triangular wave generated from an arbitrary function generator. A fiber polarization controller is used to regulate the polarization state of the input light to promise optimal coupling efficiency. The pressure is controlled by the regulator, while a gauge is used to record the applied pressure. Note that one of the ports of the MBR is sealed by ultraviolet glue and the other is connected to a compressed air source. To ensure the stability of the coupling system, the MBR is physically attached to the tapered fiber. The transmission spectra are recorded through a low-noise photodetector in real time as the input data set for the neural network and are monitored by an oscilloscope. Figure 1(b) shows the entire process of sensing signal analysis. The WGM spectra manifest discriminative characteristics at different pressures, which means that the pressure uniquely determines the entire pattern of the transmission spectrum. Hence, the full transmission spectra are collected as raw data and fed into the neural network model. The actual pressure can be directly read out via the training and testing stages.
Figure 1.Schematic of ergodic spectra sensing for pressure measurement, including (a) the experimental setup and (b) data analysis process. VOA, variable optical attenuator; FPC, fiber polarization controller; PD, photodetector; OSC, oscilloscope; AFG, arbitrary function generator.
The MBR is selected as the experimental platform due to the dense WGM spectra and inherent microfluidic channel. We fabricate the MBR using a silica hollow capillary by the “heat-and-expand” method [15,38]. First, the diameter of a silica capillary is tapered to μ through a heating and pulling process using a hydrogen flame, as shown in the left panel of Fig. 2(a). Then, the capillary is further heated and gradually expanded into a bubble, as shown in the right panel of Fig. 2(a). The -factor of is obtained via Lorentzian fitting [Fig. 2(b)]. The rich spectral features are demonstrated by measuring transmission spectra when the laser wavelength is scanned from 778 to 780 nm, as displayed in Fig. 2(c). The number of prominent resonant modes of 324 is automatically probed via the “find-peaks” algorithm in MATLAB with the threshold of 0.13. Figure 2(d) shows the long-term stability of the MBR, and the measured maximum wavelength shift is . We further introduce the Allan variance to reflect the intrinsic noise of the system, as shown in the inset of Fig. 2(d). It can be seen that the Allan variance decreases to a minimum value at and then rises, which is mainly determined by the thermal noise of the laser source and environment. In addition, the aerostatic pressure sensing ability of the MBR is demonstrated by tracking the resonant wavelength changes of a single mode. The wavelength shift is mainly contributed by the stress-induced refractive index changes and size expansion [39]. The pressure sensitivity of 0.55 pm/kPa is attained via linear fitting, as shown in Fig. 2(e). Figure 2(f) shows the real-time wavelength shift of a single mode by continuously increasing and decreasing the aerostatic pressure. The average response time of pressurization and decompression process is and , respectively. The resonant wavelength restores to the original position when the pressure returns to the initial state, showing the good reversibility of the MBR sensors.
Figure 2.(a) Microscope images of the hollow silica capillary (left) and the fabricated MBR (right); (b) measured spectra around the resonant wavelength at 778.9532 nm; (c) transmission spectra of the MBR with the wavelength ranging from 778 to 780 nm; (d) long-term stability of MBR (inset, Allan variance of resonant wavelength); (e) dependence of the wavelength shift on pressure variations; (f) real-time wavelength shift with progressively increasing and decreasing pressure.
The database is composed of transmission spectra, which is divided into training and testing data sets [Fig. 3(a)]. Each spectrum is labeled with corresponding pressure and converted into a matrix [Fig. 3(b)]. Next, these matrices are fed into a fully connected three-layer perceptron neural network to estimate the target aerostatic pressure [Fig. 3(c)]. The neurons of the input layer comprise independent variables, i.e., the raw data of a full spectrum. Then, the full spectrum is transmitted to the hidden layer with neurons. Subsequently, the information is transferred from the hidden layer to the output layer, and the value of the neuron in the output layer is determined by the following equation: where is the bias, and are the weight factor of the input layer and output layer of links, respectively, is the th input data, and is the nonlinear activation function.
Figure 3.(a) The transmission spectra are collected as raw data to form a database. (b) Conversion of transmission spectra to matrix, where the and are the number of samples and input neurons, respectively; (c) schematic diagram of the fully connected three-layer perceptron neural network used for ergodic spectra sensing; (d) MSE over different epochs; (e) effects of neurons’ number in hidden layer on prediction accuracy; (f) learning rate versus prediction accuracy.
The detailed implementation process is as follows. First, the transmission spectra at different pressures should be collected as training data sets before the actual measurement. Here, the training data sets consist of paired input spectra and output labels. Then, the actual measurement is carried out and the extra transmission spectra are recorded as testing data sets. Next, the training data sets are fed into the neural network, and the model is trained through the backpropagation algorithm, which regulates the weight based on the gradient descent method [40]. After reaching the training goal, a high-quality MLP neural network is obtained. Meanwhile, the nonlinear mapping relationship between the input transmission spectra and the output target parameters is established. Finally, the testing data sets are input into the trained network, and the actual value of target parameters can be expeditiously read out.
4. RESULTS AND DISCUSSION
Here, we exploit a fully connected three-layer neural network as a regressor to predict the actual pressure, which comprises one input layer, one hidden layer, and one output layer. The activated function is rectified linear units (ReLUs) while the mean square error (MSE) is chosen as the loss function. In order to optimize the performance of the neural network, we interrogate the influences of different network parameters (i.e., epoch, the number of neurons in the hidden layer, and the learning rate) on accuracy, as shown in Figs. 3(d)–3(f). Finally, the epochs are selected as 30, the optimal neurons of the hidden layer are set as 100, and the learning rate is set as . The neurons of the input layer are 5000, and the output layer has one neuron. We introduce the coefficient of determination () to characterize the accuracy of the predicted neural network model, which reflects the goodness of regression and is defined as where and are the th true value and estimated value, is the average value of ground truth, and is the number of predictions. Additionally, when the pressure changes from 0 to 100 kPa in steps of 5 kPa, we collect 600 groups of transmission spectra at each pressure as training data sets while collecting 150 groups of transmission spectra as testing data sets for the blind test of the network. Therefore, there are totally 12,600 for the training samples and 3150 for the testing samples. Note that the training and testing data sets are recorded independently, without any overlap, which promises that the trained network does not contain the information of testing data sets.
Figure 4(a) shows that all predicted data points fall on the measured curve, representing the high prediction accuracy. Specifically, the prediction accuracy is determined to be 99.97%. The histogram distribution of prediction error of 3150 testing samples is shown in Fig. 4(b). Herein, the prediction error is defined as the difference between predicted points and ground truth points. All predictions have an error of less than 1.8 kPa, with more than 90% of predicted values below 0.75 kPa. The calculated average prediction error is 0.32 kPa, with the standard deviation of 0.36 kPa.
Figure 4.Pressure predicted by a fully connected three-layer perceptron neural network. (a) Dependence of predicted pressure on ground truth; (b) histogram of prediction errors of 3150 testing samples in (a); (c) comparison between predictions and ground truth of arbitrary unknown pressure; (d) histogram of prediction errors of 1650 testing samples in (c).
When exploiting the same WGM microsensor, we further realize the prediction of arbitrary pressure within the measurement range. Experimentally, the WGM transmission spectra are first collected as training data sets when the pressure is increased from 30 to 80 kPa with the step of 10 kPa, while the testing data sets are recorded in steps of 5 kPa. The network parameters, activated function, and loss function are consistent with the aforementioned network model. Figure 4(c) exhibits the correlation between predicted pressure of each sample and ground truth, while the prediction error distribution histogram is shown in Fig. 4(d). It can be seen that the predicted data (blue dots) are located close to the ground truth (purple dots), and the prediction accuracy reaches up to 99.51%. The average error is 0.87 kPa, with a standard deviation of 0.69 kPa. Remarkably, the predicted pressure manifests excellent linearity (red line) with the ground truth. Each predicted data point falls within the 95% prediction bands (orange area), again exhibiting the excellent precision of the proposed method.
Furthermore, the proposed ergodic spectra sensing method and local features (i.e., resonant wavelength of multiple modes) extraction are compared. The transmission spectra over the pressure ranges of 30–80 kPa and 35–75 kPa are collected in steps of 10 kPa as training and testing data sets, respectively. The prediction accuracy of 98.94% is obtained when the full spectra are fed into the three-layer perceptron neural network model, as depicted in Fig. 5(a). The prediction accuracy of 87.43% is obtained by exploiting the resonant wavelength of multiple modes, which is 11.51% lower than the ergodic spectra sensing, as shown in Fig. 5(b). Note that a four-layer perceptron neural network is used to analyze the extracted local features, which consists of one input layer, two hidden layers, and one output layer. There are 20 neurons in the input layer, and the output layer has one neuron. The first hidden layer has 100 neurons, while the second layer has 50, and the epochs have 3000. Compared with the MLP model used for ergodic spectra sensing, it is worth noting that the epochs are increased from 30 to 3000, and the hidden layers are set as 2. This is mainly because that the prediction error is so large that it is difficult to converge when adopting the same neural network model. The intelligent sensing system unveils the great potential for high-precision measurement of actual pressure.
Figure 5.(a) The prediction accuracy of 98.94% is obtained by extracting global features of a full spectrum with a fully connected three-layer perceptron neural network. (b) As a comparison, the prediction accuracy of only 87.43% is obtained by simply employing the resonant wavelength of multiple modes with a fully connected four-layer perceptron neural network.
In summary, we propose an ML-assisted ergodic spectra sensing method in an optofluidic resonator for the direct readout of actual pressure with ultrahigh accuracy. The prediction accuracy of pressure is up to 99.97%, with an average error of 0.32 kPa. Over 90% of the predicted values have an error less than 0.75 kPa. The arbitrary target pressure is directly predicted with an accuracy of 99.51% in the range of measurement. It is noted that the predicted value of each sample in the testing data sets falls within the 95% prediction bands. Moreover, the ergodic spectra sensing accuracy is higher than that of simply extracting resonating modes’ wavelength, demonstrating the high precision of ergodic spectral sensing. Compared with the conventional single-mode sensing mechanism, the proposed method promises the potential for the direct readout of actual pressure without the limitation of laser scanning. It plays significant roles in the high-precision measurement for the generalization of the MLP model to another WGM sensor without the retraining process by optimizing the model in future work. In addition, it also provides more degrees of freedom, enabling the measurement of multiparameters. Remarkably, the proposed ML-assisted ergodic spectra sensing method is not only used for pressure sensing, but also can be implemented in gas sensing, biochemical sensing, and other fields. This study lays the foundation for the development of intelligent sensing based on optical microresonators.
Acknowledgment
Acknowledgment. The authors would like to thank Dr. Xiao-Chong Yu from Beijing Normal University, and Prof. Cuicui Lu from the Beijing Institute of Technology for helpful discussions.