
Hang Liu, Xili Wang. Remote Sensing Image Segmentation Model Based on Attention Mechanism[J]. Laser & Optoelectronics Progress, 2020, 57(4): 041015
- Laser & Optoelectronics Progress
- Vol. 57, Issue 4, 041015 (2020)
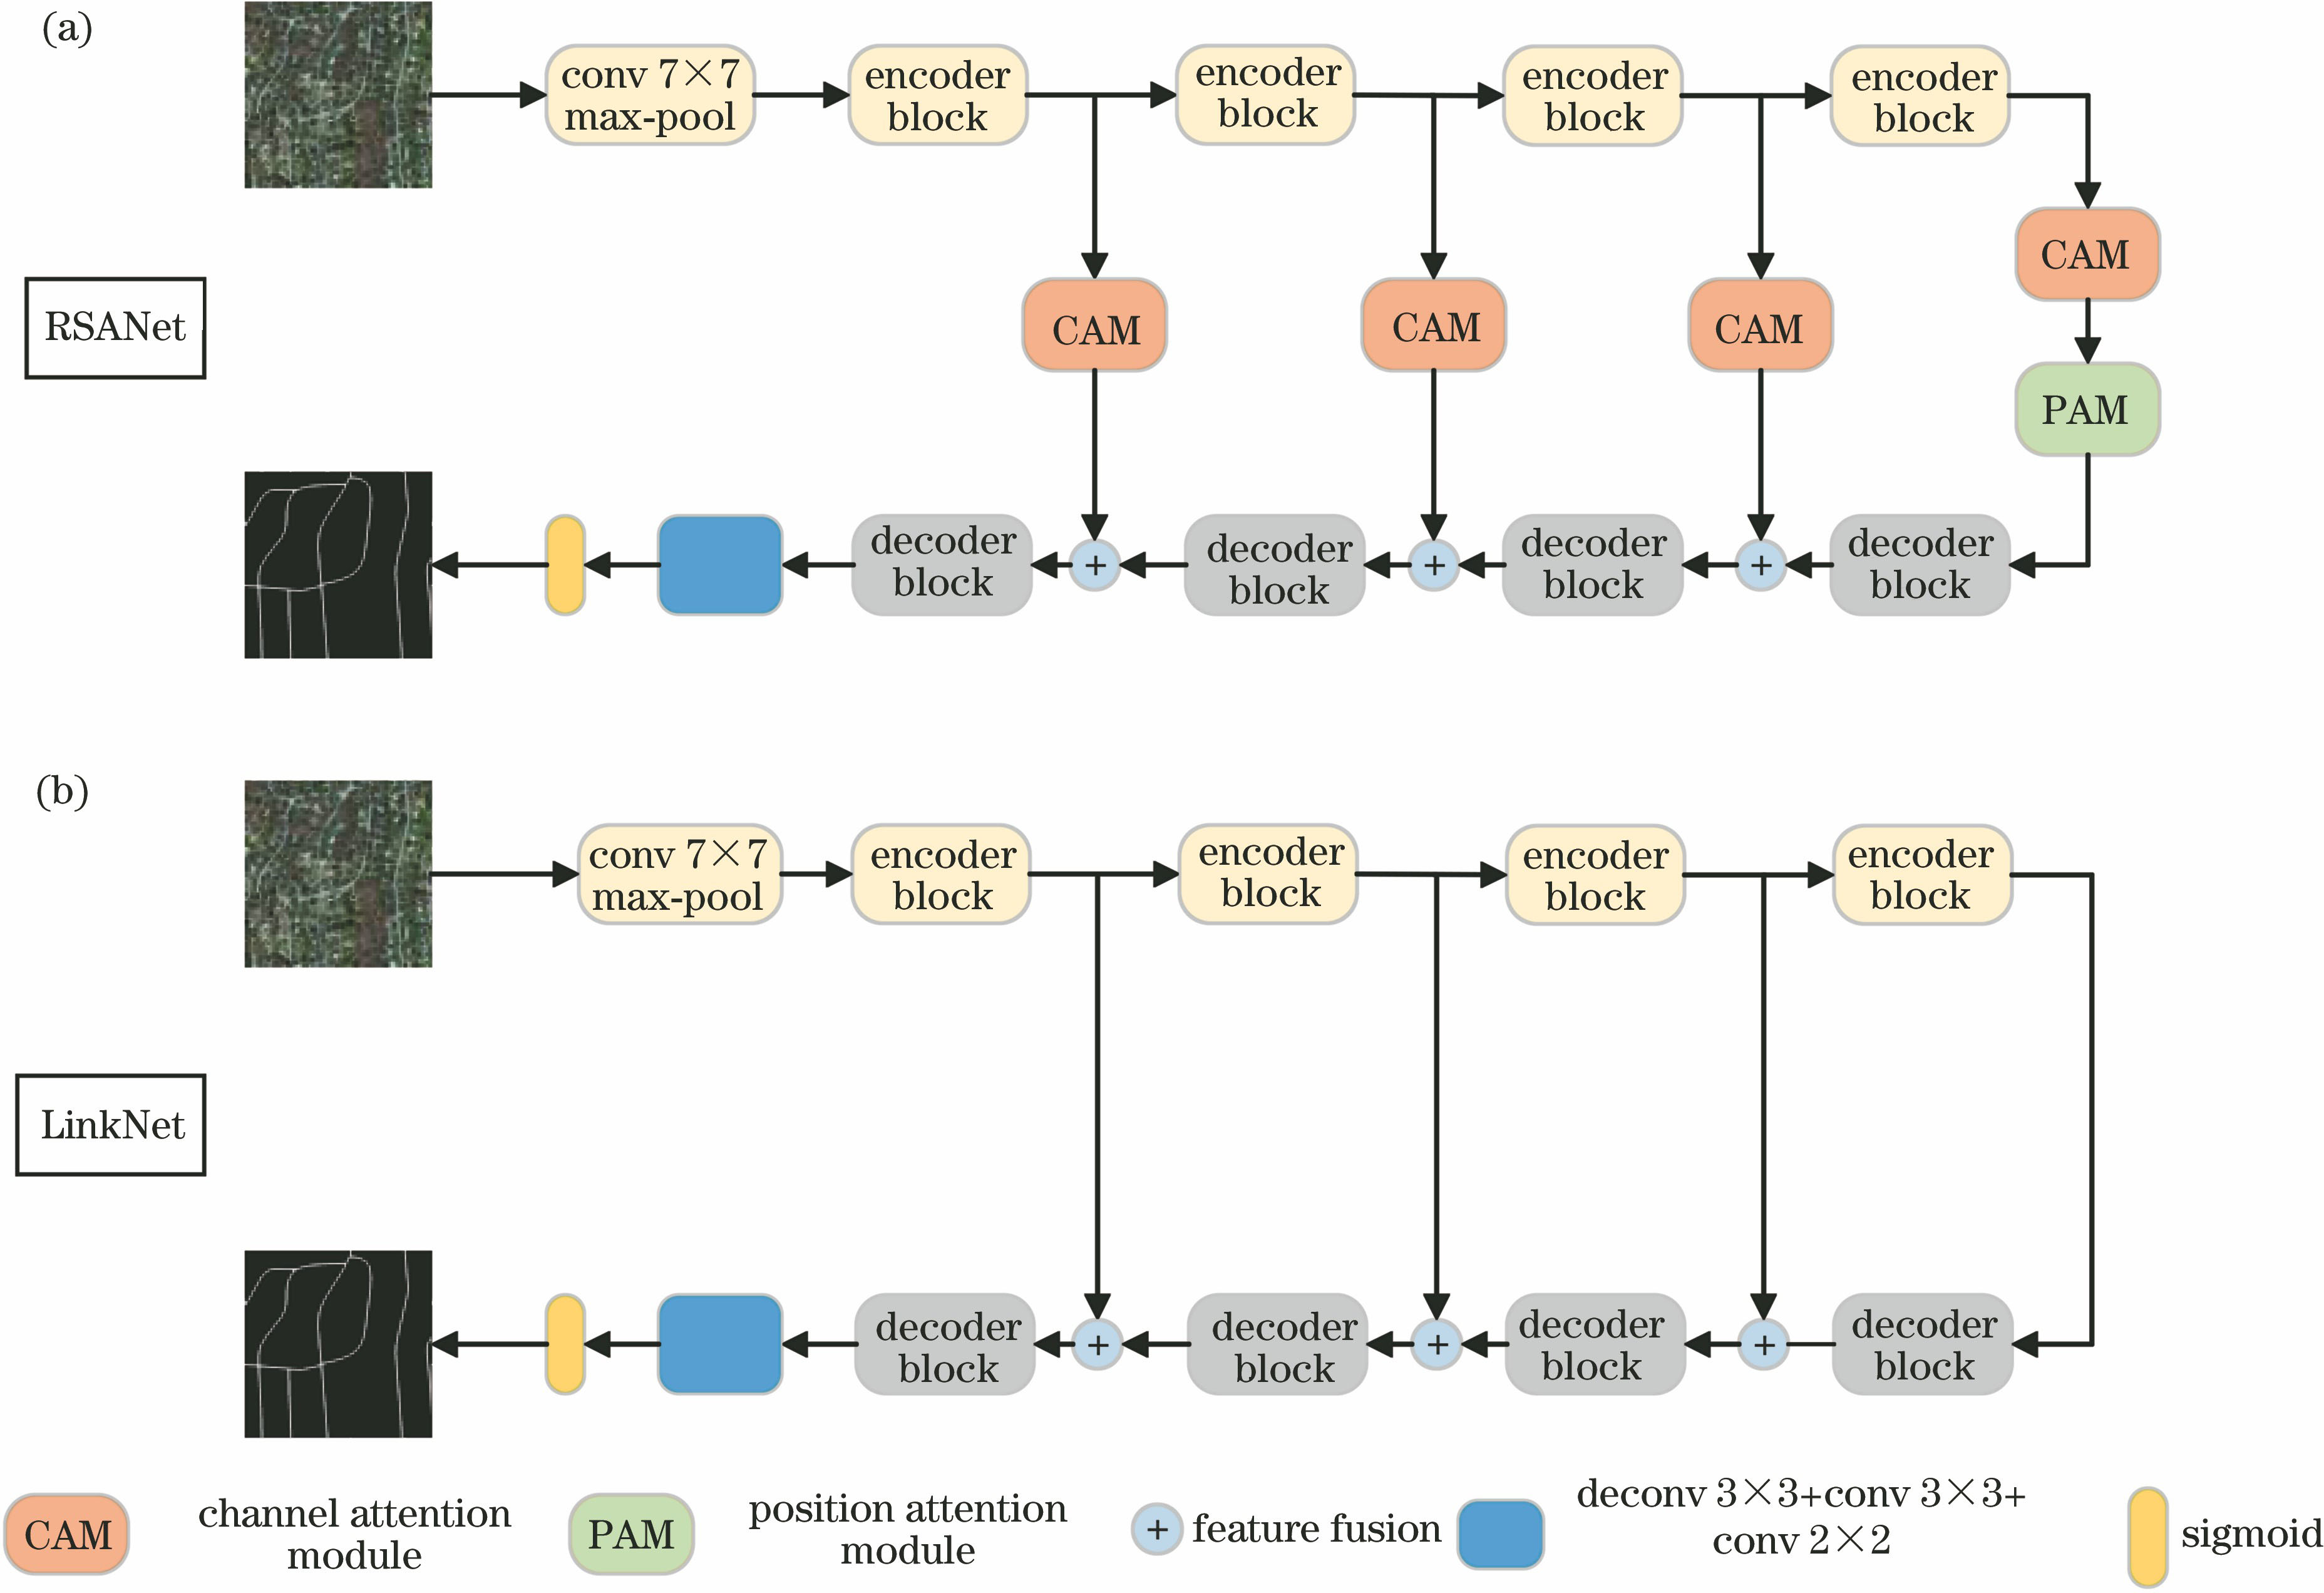
Fig. 1. Comparison between RSANet and LinkNet. (a) RSANet; (b) LinkNet
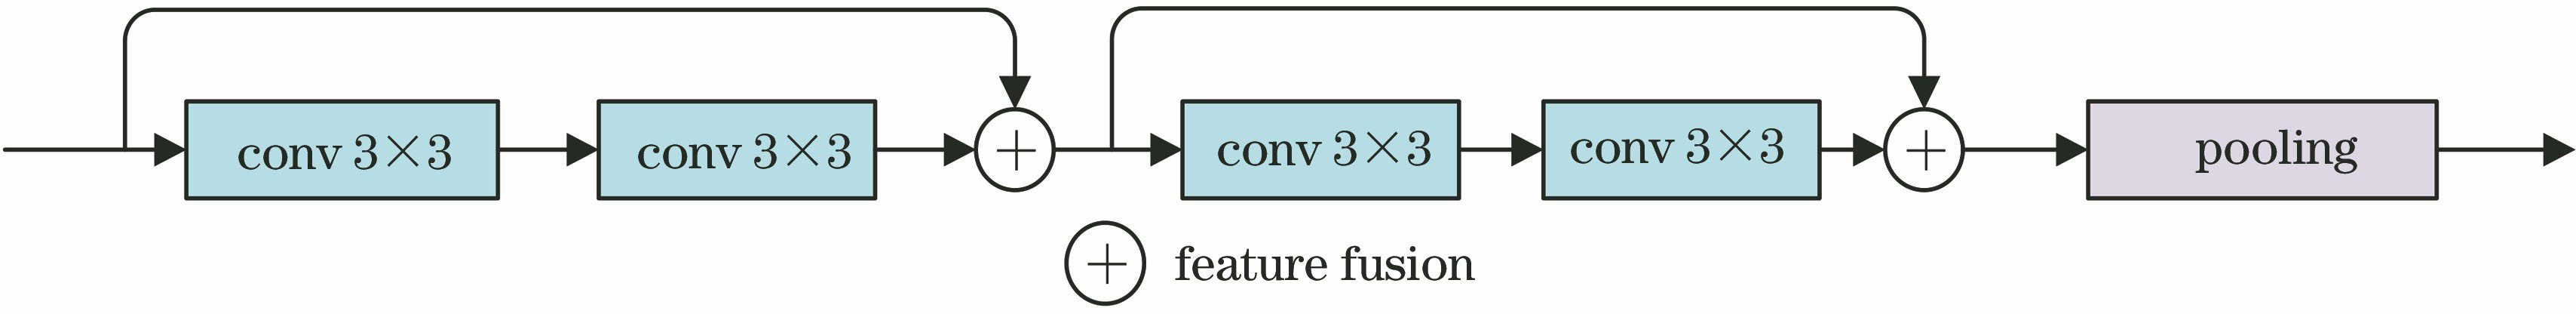
Fig. 2. Structure of encoder block
Fig. 3. Structure of decoder block
Fig. 4. Position attention module
Fig. 5. Channel attention module
Fig. 6. Remote sensing images and road labels in Massachusetts Roads dataset. (a) Part of the remote sensing images in the training set; (b) road labels corresponding to images in the training set; (c) some remote sensing images in the test set; (d) road labels corresponding to images in the test set
Fig. 7. Remote sensing images and road labels in DeepGlobe dataset. (a) Part of the remote sensing images in the training set; (b) road labels corresponding to images in the training set; (c) some remote sensing images in the test set; (d) road labels corresponding to images in the test set
Fig. 8. Segmentation results of different depth models in the Massachusetts Roads test set. (a) Original images; (b) labels; (c) segmentation results of LinkNet; (d) segmentation results of RSANet
Fig. 9. Segmentation results of different depth models on the DeepGlobe Road Extraction test set. (a) Original images; (b) labels; (c) segmentation results of LinkNet; (d) segmentation results of RSANet
| |||||||||||||||||||||||||||||||||||||||||||||||||||||||||||||
Table 1. Segmentation results of depth models on each test image in Fig. 8
|
Table 2. Segmentation results of different depth models on the Massachusetts Roads test set
| |||||||||||||||||||||||||||||||||||||||||||||||||||||||||||||
Table 3. Segmentation results of different depth models on each test image in Fig. 9
|
Table 4. Segmentation results of different depth models on the DeepGlobe Road Extraction test set
|
Table 5. Segmentation results of different depth models on the Massachusetts Roads test set
|
Table 6. Segmentation results of different depth models on the DeepGlobe Road Extraction test set

Set citation alerts for the article
Please enter your email address
© Copyright 2018-2021 | Chinese Laser Press. All Rights Reserved 沪ICP备15018463号-20