• Photonics Insights
  • Vol. 2, Issue 3, R06 (2023)
Yuxuan Chen1, Yuhang He1, Liyuan Liu1, Zhen Tian1、*, Xi-Cheng Zhang2、*, and Jianming Dai1、*
Author Affiliations
  • 1Center for Terahertz Waves & School of Precision Instrument and Opto-electronics Engineering, Tianjin University, Tianjin, China
  • 2The Institute of Optics, University of Rochester, Rochester, USA
  • show less
    DOI: 10.3788/PI.2023.R06 Cite this Article Set citation alerts
    Yuxuan Chen, Yuhang He, Liyuan Liu, Zhen Tian, Xi-Cheng Zhang, Jianming Dai. Plasma-based terahertz wave photonics in gas and liquid phases[J]. Photonics Insights, 2023, 2(3): R06 Copy Citation Text show less
    Schematic diagrams of methods used for THz wave emission from ambient air or selected gases. (a) Single-wavelength laser excitation (ω or 2ω): the THz wave emission process is attributed to ponderomotive force-induced dipole oscillation. (b) Most commonly used and convenient method with two-color excitation (ω and 2ω): a fundamental pulse (ω) is focused through a β-BBO crystal (typically 0.10 mm thick) to generate a second-harmonic pulse (2ω) that is then mixed with the residual ω pulse in the plasma. (c) A dichroic mirror (DM) is used to combine the second-harmonic beam with the ω beam in a two-color laser excitation scheme, and in this case, the relative phase, polarization, and amplitude of either laser beam (ω or 2ω) can be controlled independently for coherent control of THz wave emission, including THz wave polarization control.
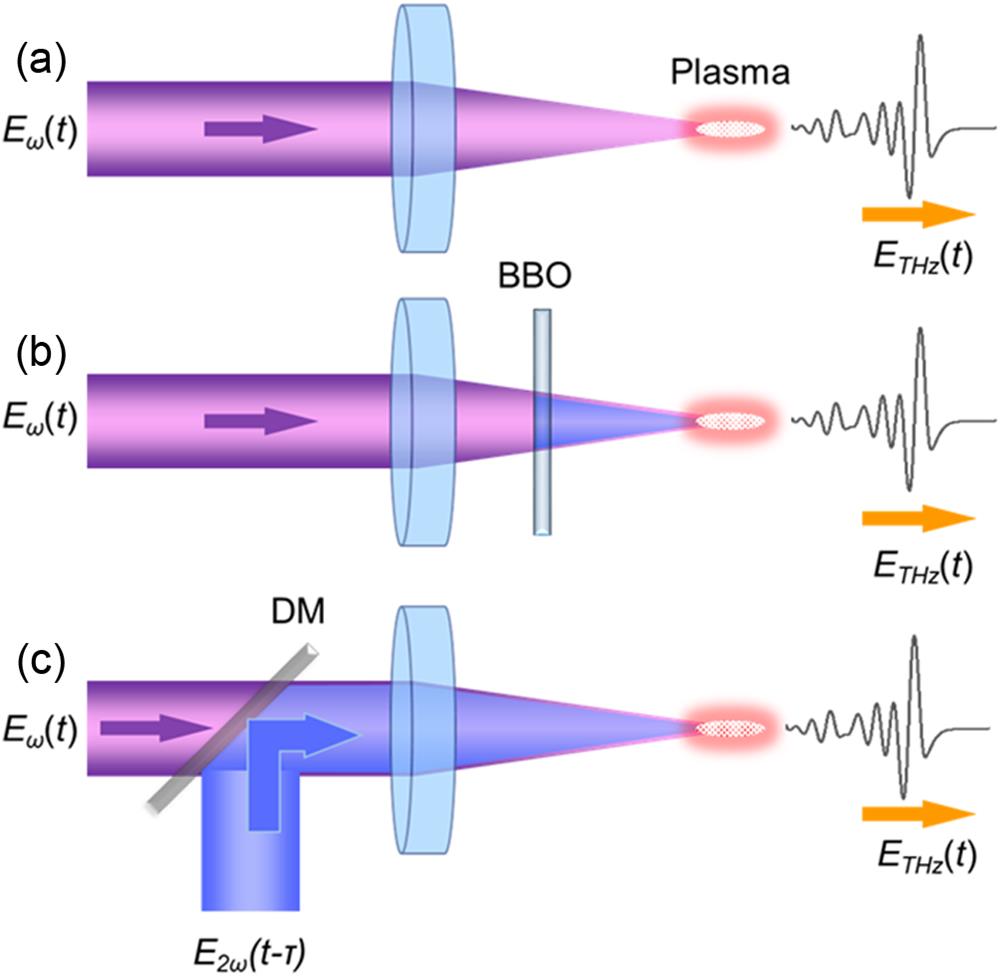
    Fig. 1. Schematic diagrams of methods used for THz wave emission from ambient air or selected gases. (a) Single-wavelength laser excitation (ω or 2ω): the THz wave emission process is attributed to ponderomotive force-induced dipole oscillation. (b) Most commonly used and convenient method with two-color excitation (ω and 2ω): a fundamental pulse (ω) is focused through a β-BBO crystal (typically 0.10 mm thick) to generate a second-harmonic pulse (2ω) that is then mixed with the residual ω pulse in the plasma. (c) A dichroic mirror (DM) is used to combine the second-harmonic beam with the ω beam in a two-color laser excitation scheme, and in this case, the relative phase, polarization, and amplitude of either laser beam (ω or 2ω) can be controlled independently for coherent control of THz wave emission, including THz wave polarization control.
    Comparison between THz waveforms generated from single-color (800 nm only) and two-color (800 and 400 nm) laser-induced air plasmas. The total pump laser pulse energy for both cases is ∼0.6 mJ, and the pulse duration is about 80 fs. The environmental humidity is about 30%. The laser beam is focused by an optical lens with an effective focal length of 150 mm. The THz waveforms are obtained using electro-optic (EO) sampling with a 1.0-mm-thick ZnTe crystal.
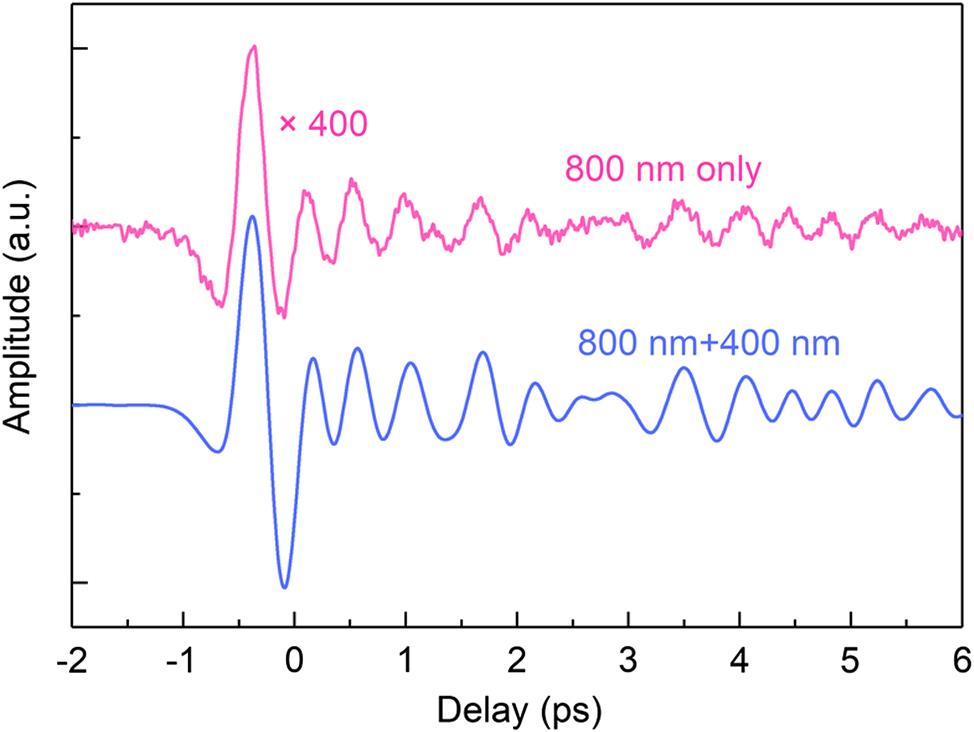
    Fig. 2. Comparison between THz waveforms generated from single-color (800 nm only) and two-color (800 and 400 nm) laser-induced air plasmas. The total pump laser pulse energy for both cases is 0.6mJ, and the pulse duration is about 80 fs. The environmental humidity is about 30%. The laser beam is focused by an optical lens with an effective focal length of 150 mm. The THz waveforms are obtained using electro-optic (EO) sampling with a 1.0-mm-thick ZnTe crystal.
    (a) Angular dependence of THz wave emission from a micro-plasma generated with laser pulse energy of 65 µJ. Δt is the time delay between the pump and probe beams for THz waveform measurement. (b) Measured detection angle dependence of THz pulse energy. The pulse energy is calculated using the THz waveforms presented in (a). The solid line represents the experimental results, while the dashed line shows the simulation result achieved using the theoretical model described in Ref. [23]. Figures reprinted from Ref. [85], Optica.
    Fig. 3. (a) Angular dependence of THz wave emission from a micro-plasma generated with laser pulse energy of 65 µJ. Δt is the time delay between the pump and probe beams for THz waveform measurement. (b) Measured detection angle dependence of THz pulse energy. The pulse energy is calculated using the THz waveforms presented in (a). The solid line represents the experimental results, while the dashed line shows the simulation result achieved using the theoretical model described in Ref. [23]. Figures reprinted from Ref. [85], Optica.
    (a) Schematic illustration of the THz wave generation process in the ionizing gas atom. Laser fields synthesized from fundamental and second-harmonic frequency components (ω and 2ω) interact with the atom, resulting in tunnel ionization. A portion of the electron wave packets formed in the ionization process are accelerated away from the atom and propagate outward (along the laser polarization axis), producing a net THz dipole moment, which consequently emits electromagnetic waves (Ω). Then, the wave packets interact with their surroundings, emitting bremsstrahlung, which adds coherently, incurring an “echo” THz pulse. (b), (c) Calculated electron density distributions for an argon atom subjected to intense optical fields synthesized from the fundamental and its second-harmonic pulses with relative phases of 5π/12 and 11π/12, leading to minimal and maximal asymmetry, respectively. Figures reprinted with permission from Ref. [86], American Physical Society.
    Fig. 4. (a) Schematic illustration of the THz wave generation process in the ionizing gas atom. Laser fields synthesized from fundamental and second-harmonic frequency components (ω and 2ω) interact with the atom, resulting in tunnel ionization. A portion of the electron wave packets formed in the ionization process are accelerated away from the atom and propagate outward (along the laser polarization axis), producing a net THz dipole moment, which consequently emits electromagnetic waves (Ω). Then, the wave packets interact with their surroundings, emitting bremsstrahlung, which adds coherently, incurring an “echo” THz pulse. (b), (c) Calculated electron density distributions for an argon atom subjected to intense optical fields synthesized from the fundamental and its second-harmonic pulses with relative phases of 5π/12 and 11π/12, leading to minimal and maximal asymmetry, respectively. Figures reprinted with permission from Ref. [86], American Physical Society.
    Schematic illustration of the experimental setup for THz-ABCD. The parabolic mirror is used to focus the collimated THz beam; the 2ω signal is created by mixing the probe beam ω and the THz electric field in air or selected gases. PMT (photomultiplier tube) is used to detect the optical signal at 2ω.
    Fig. 5. Schematic illustration of the experimental setup for THz-ABCD. The parabolic mirror is used to focus the collimated THz beam; the 2ω signal is created by mixing the probe beam ω and the THz electric field in air or selected gases. PMT (photomultiplier tube) is used to detect the optical signal at 2ω.
    (a) THz waveform and (b) its Fourier transform spectrum achieved when gas plasma is used as both the THz emitter and sensor with laser pulses of 85 fs for THz wave generation and detection.
    Fig. 6. (a) THz waveform and (b) its Fourier transform spectrum achieved when gas plasma is used as both the THz emitter and sensor with laser pulses of 85 fs for THz wave generation and detection.
    Schematic diagram of polarization-sensitive THz-ABCD. QWP, quarter wave plate; PMT, photomultiplier tube. Figure reprinted with permission from Ref. [96], AIP Publishing.
    Fig. 7. Schematic diagram of polarization-sensitive THz-ABCD. QWP, quarter wave plate; PMT, photomultiplier tube. Figure reprinted with permission from Ref. [96], AIP Publishing.
    The measured result of an elliptically polarized THz waveform. The orthogonal THz components and the polarization information are also shown as cast shadows in the figure. Figure reprinted with permission from Ref. [96], AIP Publishing.
    Fig. 8. The measured result of an elliptically polarized THz waveform. The orthogonal THz components and the polarization information are also shown as cast shadows in the figure. Figure reprinted with permission from Ref. [96], AIP Publishing.
    Schematic of balanced THz-ABCD for pulsed THz waves. WP, Wollaston prism; PMT I, PMT II, photomultiplier tubes. The diagram inside the circle shows the polarizations of the THz field ETHz, probe electric field Eω, and bias field Ebias in the Cartesian coordinate system. Figure reprinted with permission from Ref. [98], AIP Publishing.
    Fig. 9. Schematic of balanced THz-ABCD for pulsed THz waves. WP, Wollaston prism; PMT I, PMT II, photomultiplier tubes. The diagram inside the circle shows the polarizations of the THz field ETHz, probe electric field Eω, and bias field Ebias in the Cartesian coordinate system. Figure reprinted with permission from Ref. [98], AIP Publishing.
    THz wave assisted electron impact ionization of high-lying states in plasma. (a) High-lying states can be ionized by a series of collisions with electrons with high kinetic energy. (b) Interaction between the THz pulse and the asymmetric photoelectron velocity distributions generated by two-color field ionization. Figures reprinted with permission from Ref. [54], Springer Nature.
    Fig. 10. THz wave assisted electron impact ionization of high-lying states in plasma. (a) High-lying states can be ionized by a series of collisions with electrons with high kinetic energy. (b) Interaction between the THz pulse and the asymmetric photoelectron velocity distributions generated by two-color field ionization. Figures reprinted with permission from Ref. [54], Springer Nature.
    Schematic illustration of the THz wave remote sensing technique via THz-REEF. An in-line phase compensator module is used to synthesize the two-color laser fields by controlling the relative phase between the fundamental ω and its second-harmonic 2ω pulses using the wedge pair[37]. After the phase compensator, both ω and 2ω pulses are linearly polarized along a vertical direction. These two optical pulses are focused by a parabolic mirror (PM1) through another parabolic mirror (PM2) with a hole into air to create plasma. The time delay td is defined as the delay between the optical and THz pulses. The fluorescence detection module consists of a UV concave mirror (M1), UV plane mirror (M2), monochromator, and photomultiplier tube (PMT). The distance of remote sensing can be changed by moving the fluorescence detection module with respect to the plasma. DWP, dual-band wave plate. Figure reprinted with permission from Ref. [54], Springer Nature.
    Fig. 11. Schematic illustration of the THz wave remote sensing technique via THz-REEF. An in-line phase compensator module is used to synthesize the two-color laser fields by controlling the relative phase between the fundamental ω and its second-harmonic 2ω pulses using the wedge pair[37]. After the phase compensator, both ω and 2ω pulses are linearly polarized along a vertical direction. These two optical pulses are focused by a parabolic mirror (PM1) through another parabolic mirror (PM2) with a hole into air to create plasma. The time delay td is defined as the delay between the optical and THz pulses. The fluorescence detection module consists of a UV concave mirror (M1), UV plane mirror (M2), monochromator, and photomultiplier tube (PMT). The distance of remote sensing can be changed by moving the fluorescence detection module with respect to the plasma. DWP, dual-band wave plate. Figure reprinted with permission from Ref. [54], Springer Nature.
    Time-resolved fluorescence enhancement in air plasma through THz wave interaction with antiparallel, symmetric, and parallel electron drift velocities with respect to the laser field, controlled by changing the phase between the ω and 2ω optical pulses. Subtraction of the parallel curve from the antiparallel curve eliminates the incoherent energy transfer by electrons after inelastic collisions and scattering in random directions. This reveals the THz waveform in the form of fluorescence modulation. The laser pulse leads the THz pulse in time for delay td<0. Figure reprinted with permission from Ref. [104], Elsevier.
    Fig. 12. Time-resolved fluorescence enhancement in air plasma through THz wave interaction with antiparallel, symmetric, and parallel electron drift velocities with respect to the laser field, controlled by changing the phase between the ω and 2ω optical pulses. Subtraction of the parallel curve from the antiparallel curve eliminates the incoherent energy transfer by electrons after inelastic collisions and scattering in random directions. This reveals the THz waveform in the form of fluorescence modulation. The laser pulse leads the THz pulse in time for delay td<0. Figure reprinted with permission from Ref. [104], Elsevier.
    THz waveforms detected at distances of 0.1, 5, and 10 m, in comparison with that detected using traditional EO sampling. The echo in the THz waveform around 7 ps is the reflected THz pulse from the ZnTe–air interfaces. The inset shows the corresponding THz spectrum obtained by Fourier transformation of the THz waveform sensed at 10 m. Figures reprinted with permission from Ref. [54], Springer Nature.
    Fig. 13. THz waveforms detected at distances of 0.1, 5, and 10 m, in comparison with that detected using traditional EO sampling. The echo in the THz waveform around 7 ps is the reflected THz pulse from the ZnTe–air interfaces. The inset shows the corresponding THz spectrum obtained by Fourier transformation of the THz waveform sensed at 10 m. Figures reprinted with permission from Ref. [54], Springer Nature.
    (a) Schematic illustration of the experimental setup used for the TEA under excitation of single-color or dual-color laser pulses. (b) Individual photoacoustic waveforms measured at a distance of 5 mm with (red dashed curve) and without (black solid curve) a 100-kV/cm THz field. The acoustic wave is measured by a G.R.A.S. microphone. The inset shows the acoustic spectrum. Figures reprinted from Ref. [55], Optica.
    Fig. 14. (a) Schematic illustration of the experimental setup used for the TEA under excitation of single-color or dual-color laser pulses. (b) Individual photoacoustic waveforms measured at a distance of 5 mm with (red dashed curve) and without (black solid curve) a 100-kV/cm THz field. The acoustic wave is measured by a G.R.A.S. microphone. The inset shows the acoustic spectrum. Figures reprinted from Ref. [55], Optica.
    (a) Time-resolved TEA signals obtained for tR=−0.33 fs and tR=+0.33 fs. The inset shows the measured THz signals from two-color laser-induced plasma at different tR (no external THz field present), which is the phase curve. (b) THz time-domain waveforms achieved using the THz-enhanced acoustics method and EO sampling for comparison. The inset shows the corresponding THz spectra. Figures reprinted from Ref. [55], Optica.
    Fig. 15. (a) Time-resolved TEA signals obtained for tR=0.33fs and tR=+0.33fs. The inset shows the measured THz signals from two-color laser-induced plasma at different tR (no external THz field present), which is the phase curve. (b) THz time-domain waveforms achieved using the THz-enhanced acoustics method and EO sampling for comparison. The inset shows the corresponding THz spectra. Figures reprinted from Ref. [55], Optica.
    Three-dimensional quantum mechanical simulation, showing (a) electron expectation value trajectories in the dual-color field, (b) electron trajectories with the laser-driven quiver motion removed, and (c) second time derivative of the trajectories showing the effective polarization of the emitted radiation when the relative phase ϕ between the circularly polarized fundamental and second-harmonic pulses changes. (d), (e) Electron density distribution in the z–x plane (scaled logarithmically) when the phase is π and π/2, respectively. (f) Momentum space electron density distribution (scaled logarithmically, bound states removed) when phase is π/2. Figures reprinted with permission from Ref. [34], American Physical Society.
    Fig. 16. Three-dimensional quantum mechanical simulation, showing (a) electron expectation value trajectories in the dual-color field, (b) electron trajectories with the laser-driven quiver motion removed, and (c) second time derivative of the trajectories showing the effective polarization of the emitted radiation when the relative phase ϕ between the circularly polarized fundamental and second-harmonic pulses changes. (d), (e) Electron density distribution in the zx plane (scaled logarithmically) when the phase is π and π/2, respectively. (f) Momentum space electron density distribution (scaled logarithmically, bound states removed) when phase is π/2. Figures reprinted with permission from Ref. [34], American Physical Society.
    (a) Schematic diagram of the experimental setup. Enclosed in the dashed box is an in-line phase compensator. β-BBO, beta barium borate crystal; BP, birefringent plate; QW, a fused silica wedge pair used to control the relative phase between the ω and 2ω pulses; DWP, dual-wavelength wave plate (quarter-wave plate at ω and half-wave plate at 2ω); the upper and lower arrows near the laser beams represent the polarizations of the ω and 2ω pulses, respectively. (b) Phase scan obtained by monitoring the THz average power as the relative phase between the ω and 2ω pulses changes when both ω and 2ω pulses are linearly polarized and share the same polarization direction; the inset displays a zoomed-in portion of the phase scan near the “zero” phase delay.
    Fig. 17. (a) Schematic diagram of the experimental setup. Enclosed in the dashed box is an in-line phase compensator. β-BBO, beta barium borate crystal; BP, birefringent plate; QW, a fused silica wedge pair used to control the relative phase between the ω and 2ω pulses; DWP, dual-wavelength wave plate (quarter-wave plate at ω and half-wave plate at 2ω); the upper and lower arrows near the laser beams represent the polarizations of the ω and 2ω pulses, respectively. (b) Phase scan obtained by monitoring the THz average power as the relative phase between the ω and 2ω pulses changes when both ω and 2ω pulses are linearly polarized and share the same polarization direction; the inset displays a zoomed-in portion of the phase scan near the “zero” phase delay.
    THz intensity versus THz polarizer rotation angle and the relative phase between the ω and 2ω pulses (a) with left-handed circularly polarized ω pulse and elliptically polarized 2ω pulse (with an ellipticity of about 1/11 in terms of optical intensity) and (c) with both ω and 2ω beams right-handed circularly polarized. (b) is the corresponding simulation result in the case of (a), and (d) the simulation result with ideally circularly polarized optical beams. The color scale represents the THz wave power or intensity. Figures reprinted with permission from Ref. [34], American Physical Society.
    Fig. 18. THz intensity versus THz polarizer rotation angle and the relative phase between the ω and 2ω pulses (a) with left-handed circularly polarized ω pulse and elliptically polarized 2ω pulse (with an ellipticity of about 1/11 in terms of optical intensity) and (c) with both ω and 2ω beams right-handed circularly polarized. (b) is the corresponding simulation result in the case of (a), and (d) the simulation result with ideally circularly polarized optical beams. The color scale represents the THz wave power or intensity. Figures reprinted with permission from Ref. [34], American Physical Society.
    (a) Schematic diagram of the experimental setup. A femtosecond laser pulse is focused by a lens to form a laser filament in air. A β-BBO crystal is inserted in the laser beam for second-harmonic generation, and an in-line phase compensator (IPC) is employed for the control of the relative phase change between the ω and 2ω pulses. Both ω and 2ω beams are linearly polarized after the IPC, where their polarization directions differ by 46° (θω≈−π/4 and θ2ω≈−π/2). Then, the linearly polarized ω pulse is converted to a circularly polarized pulse by a quarter-wave plate (QWP) with its optical axis parallel to the polarization direction of the 2ω pulse. The probe beam and THz beam are focused collinearly into the ZnTe crystal for electric-optical sampling of the THz waveforms. α=40°. Inset: modification of plasma filament length by moving a metal iris with a 2-mm clear aperture. (b), (d) Far-field polarization trajectories (Ex(t), Ey(t)) of THz radiations obtained experimentally from a short filament and long filament, respectively, when the relative phase between the ω and 2ω pulses is changed with a step size of 0.21π. (c), (e) Simulation results are shown for a short filament (c) and long filament (e). (f), (g) Typical waveforms (f) and their Fourier transform spectra (g) of measured elliptically polarized radiation from a 23-mm-long filament. Figures reprinted with permission from Ref. [89], Springer Nature.
    Fig. 19. (a) Schematic diagram of the experimental setup. A femtosecond laser pulse is focused by a lens to form a laser filament in air. A β-BBO crystal is inserted in the laser beam for second-harmonic generation, and an in-line phase compensator (IPC) is employed for the control of the relative phase change between the ω and 2ω pulses. Both ω and 2ω beams are linearly polarized after the IPC, where their polarization directions differ by 46° (θωπ/4 and θ2ωπ/2). Then, the linearly polarized ω pulse is converted to a circularly polarized pulse by a quarter-wave plate (QWP) with its optical axis parallel to the polarization direction of the 2ω pulse. The probe beam and THz beam are focused collinearly into the ZnTe crystal for electric-optical sampling of the THz waveforms. α=40°. Inset: modification of plasma filament length by moving a metal iris with a 2-mm clear aperture. (b), (d) Far-field polarization trajectories (Ex(t), Ey(t)) of THz radiations obtained experimentally from a short filament and long filament, respectively, when the relative phase between the ω and 2ω pulses is changed with a step size of 0.21π. (c), (e) Simulation results are shown for a short filament (c) and long filament (e). (f), (g) Typical waveforms (f) and their Fourier transform spectra (g) of measured elliptically polarized radiation from a 23-mm-long filament. Figures reprinted with permission from Ref. [89], Springer Nature.
    (a) THz electric field as a function of time delay and relative phase in the time domain. (b) 3D plot of the THz spectral change in THz amplitude versus the relative phase. (c) Normalized 3D THz spectrum in amplitude. (d) Individual THz emission spectra (normalized) at different relative phases, showing the THz emission spectral change versus relative phase.
    Fig. 20. (a) THz electric field as a function of time delay and relative phase in the time domain. (b) 3D plot of the THz spectral change in THz amplitude versus the relative phase. (c) Normalized 3D THz spectrum in amplitude. (d) Individual THz emission spectra (normalized) at different relative phases, showing the THz emission spectral change versus relative phase.
    (a) THz waveform (top) obtained when the relative phase between the ω and 2ω pulses reaches the optimal value for maximal THz emission from the plasma and the THz waveform (times a factor of eight for clarity, and it is an average of 25 individual scans for sufficient dynamic range) obtained when the phase reaches a value at which the THz emission efficiency is minimized. Both waveforms were measured using EO sampling with a 0.3-mm, 〈110〉 cut GaP crystal. (b) Corresponding spectra for waveforms displayed in (a).
    Fig. 21. (a) THz waveform (top) obtained when the relative phase between the ω and 2ω pulses reaches the optimal value for maximal THz emission from the plasma and the THz waveform (times a factor of eight for clarity, and it is an average of 25 individual scans for sufficient dynamic range) obtained when the phase reaches a value at which the THz emission efficiency is minimized. Both waveforms were measured using EO sampling with a 0.3-mm, 110 cut GaP crystal. (b) Corresponding spectra for waveforms displayed in (a).
    A typical THz waveform and its Fourier transform spectrum at moderate pump pulse energy and pulse duration. A pump pulse with 100-fs pulse duration and 600-μJ pulse energy is focused through a β-BBO crystal for second-harmonic generation using a lens with an effective focal length of 150 mm to create plasma and generate a THz wave, and the same laser pulse with reduced pulse energy is utilized to detect the emitted THz wave using EO sampling with a 0.3-mm, 〈110〉 cut GaP crystal. The dynamic range of the THz signal in time-domain is over 8000.
    Fig. 22. A typical THz waveform and its Fourier transform spectrum at moderate pump pulse energy and pulse duration. A pump pulse with 100-fs pulse duration and 600-μJ pulse energy is focused through a β-BBO crystal for second-harmonic generation using a lens with an effective focal length of 150 mm to create plasma and generate a THz wave, and the same laser pulse with reduced pulse energy is utilized to detect the emitted THz wave using EO sampling with a 0.3-mm, 110 cut GaP crystal. The dynamic range of the THz signal in time-domain is over 8000.
    (a) Clear picture of the two-color laser-induced plasma in nitrogen gas created by an 800-nm, 28-fs, 2.7-mJ laser pulse focused through a 0.1-mm β-BBO by a 150-mm fused silica lens. The plasma length is about 10 mm measured by vision. (b) Series of THz waveforms obtained with different numbers of silicon wafers used to attenuate the THz electric field, showing the saturation of the EO-sampling system with a 0.106-mm GaP by the THz wave with high peak electric field. Knowing the refractive index of GaP crystal, the thickness of the crystal can be very precisely calibrated simply by locating the second THz waveform reflected by the GaP–air and air–GaP interfaces in the time domain. (c) THz waveform with a peak electric field of 1.41 MV/cm and (d) corresponding Fourier transform spectrum.
    Fig. 23. (a) Clear picture of the two-color laser-induced plasma in nitrogen gas created by an 800-nm, 28-fs, 2.7-mJ laser pulse focused through a 0.1-mm β-BBO by a 150-mm fused silica lens. The plasma length is about 10 mm measured by vision. (b) Series of THz waveforms obtained with different numbers of silicon wafers used to attenuate the THz electric field, showing the saturation of the EO-sampling system with a 0.106-mm GaP by the THz wave with high peak electric field. Knowing the refractive index of GaP crystal, the thickness of the crystal can be very precisely calibrated simply by locating the second THz waveform reflected by the GaP–air and air–GaP interfaces in the time domain. (c) THz waveform with a peak electric field of 1.41 MV/cm and (d) corresponding Fourier transform spectrum.
    (a) THz waveform detected with THz-ABCD technique, showing that a peak electric field of ∼1.9 MV/cm is achieved. (b) Fourier transform spectrum of the THz wave, indicating that a frequency coverage of nearly 100 THz is obtained. The spectral plateau can cover the entire THz band and beyond.
    Fig. 24. (a) THz waveform detected with THz-ABCD technique, showing that a peak electric field of 1.9MV/cm is achieved. (b) Fourier transform spectrum of the THz wave, indicating that a frequency coverage of nearly 100 THz is obtained. The spectral plateau can cover the entire THz band and beyond.
    (a) Transmitted spectra of THz waves when the metamaterial sample using GaAs/AlGaAs multiple quantum well as the substrate is at different positions (different THz electric field strengths) along THz beam path. (b) Transmitted spectra of the GaAs/AlGaAs multiple quantum well substrate at different positions. (c) Normalized transmission spectra of the material sample at different positions. (d) Three normalized transmission spectra at different sample positions, corresponding to three THz electric fields of about 390, 430, and 530 kV/cm. The THz beam waist is located at a position of 1.4 mm. Inset of (d) shows the golden metamaterial pattern fabricated on GaAs/AlGaAs multiple quantum well substrate.
    Fig. 25. (a) Transmitted spectra of THz waves when the metamaterial sample using GaAs/AlGaAs multiple quantum well as the substrate is at different positions (different THz electric field strengths) along THz beam path. (b) Transmitted spectra of the GaAs/AlGaAs multiple quantum well substrate at different positions. (c) Normalized transmission spectra of the material sample at different positions. (d) Three normalized transmission spectra at different sample positions, corresponding to three THz electric fields of about 390, 430, and 530 kV/cm. The THz beam waist is located at a position of 1.4 mm. Inset of (d) shows the golden metamaterial pattern fabricated on GaAs/AlGaAs multiple quantum well substrate.
    Schematic illustration of the experimental setup for intense THz wave generation via two-color laser filamentation in air and characterization. To maximize THz wave generation efficiency, a dichroic λ/2 wave plate and a large-sized (4 in.) Brewster-angled high-resistivity silicon (Si) window are used. THz waveforms, energies, and beam profiles are measured to determine the peak THz field (∼8 MV/cm). An uncooled microbolometer focal plane array with various filters in two different modes is used to measure the THz wave beam profile. Figure reprinted with permission from Ref. [110], AIP Publishing.
    Fig. 26. Schematic illustration of the experimental setup for intense THz wave generation via two-color laser filamentation in air and characterization. To maximize THz wave generation efficiency, a dichroic λ/2 wave plate and a large-sized (4 in.) Brewster-angled high-resistivity silicon (Si) window are used. THz waveforms, energies, and beam profiles are measured to determine the peak THz field (8MV/cm). An uncooled microbolometer focal plane array with various filters in two different modes is used to measure the THz wave beam profile. Figure reprinted with permission from Ref. [110], AIP Publishing.
    Experimental scheme for high-field THz wave generation from a two-dimensional (2D) plasma sheet created by focusing the laser beam with a cylindrical lens. The 2D plasma sheet emits an array of vertically overlapping conical THz beams, resulting in two upright THz lobes in the far field due to constructive interference. Figure reprinted with permission from Ref. [111], AIP Publishing.
    Fig. 27. Experimental scheme for high-field THz wave generation from a two-dimensional (2D) plasma sheet created by focusing the laser beam with a cylindrical lens. The 2D plasma sheet emits an array of vertically overlapping conical THz beams, resulting in two upright THz lobes in the far field due to constructive interference. Figure reprinted with permission from Ref. [111], AIP Publishing.
    Experimental setup for high-energy THz pulse generation from laser-induced plasma filament in gases. The optical elements in the dashed frame need to be removed when measuring the THz autocorrelation curve (i.e., FTIR time-domain signal). HWP, half-wave plate; L, lens; β, β-BBO; α, α-BBO; DWP, dual-wavelength plate; TFL, Teflon; OAP, 90° off-axis parabolic mirror; Si, silicon wafer; GC, Golay cell. Inset: schematic diagram showing how to achieve the precise spatial superposition of the ω1 and ω2 beams by tilting the α-BBO crystal. Figure reprinted from Ref. [115].
    Fig. 28. Experimental setup for high-energy THz pulse generation from laser-induced plasma filament in gases. The optical elements in the dashed frame need to be removed when measuring the THz autocorrelation curve (i.e., FTIR time-domain signal). HWP, half-wave plate; L, lens; β, β-BBO; α, α-BBO; DWP, dual-wavelength plate; TFL, Teflon; OAP, 90° off-axis parabolic mirror; Si, silicon wafer; GC, Golay cell. Inset: schematic diagram showing how to achieve the precise spatial superposition of the ω1 and ω2 beams by tilting the α-BBO crystal. Figure reprinted from Ref. [115].
    Schematic of the experimental setup. The THz power is measured by a Golay cell. Figure reprinted with permission from Ref. [116], AIP Publishing.
    Fig. 29. Schematic of the experimental setup. The THz power is measured by a Golay cell. Figure reprinted with permission from Ref. [116], AIP Publishing.
    Dependence of THz power on the relative phase between the two-color fields. THz radiation is emitted from ionizing argon gas jet at a back pressure of 200 mbar with a laser peak power intensity of 3×10¹⁴ W/cm2 in cases of two-color laser fields circularly polarized with the same (CP-S) (↻↻, red line) and counter (CP-C) (↻↺, pink line) helicities as well as linearly polarized with the same (LP-P) (↕↕, blue line) and orthogonal (LP-O) (↕↔, black line) polarization directions. The inset indicates the THz power in cases of LP-O and CP-C. Figure reprinted with permission from Ref. [116], AIP Publishing.
    Fig. 30. Dependence of THz power on the relative phase between the two-color fields. THz radiation is emitted from ionizing argon gas jet at a back pressure of 200 mbar with a laser peak power intensity of 3×10¹⁴W/cm2 in cases of two-color laser fields circularly polarized with the same (CP-S) (, red line) and counter (CP-C) (, pink line) helicities as well as linearly polarized with the same (LP-P) (, blue line) and orthogonal (LP-O) (, black line) polarization directions. The inset indicates the THz power in cases of LP-O and CP-C. Figure reprinted with permission from Ref. [116], AIP Publishing.
    (a) Dependence of emitted THz energy on the pump laser wavelength obtained by numerical simulation (red solid curve). The black dashed curve shows the simulation result on the plasma density (right axis). The THz energy in (a) is normalized and the experimental data are overlapped for clarity (solid circles). (b) Recorded THz energy achieved at 12 different pump wavelengths ranging from 0.8 to 2.02 µm (solid circles). The red solid curve shows the power law fit (λ4.6±0.5) along with the 65% confidence bounds (red dashed curves). Figures reprinted with permission from Ref. [38], American Physical Society.
    Fig. 31. (a) Dependence of emitted THz energy on the pump laser wavelength obtained by numerical simulation (red solid curve). The black dashed curve shows the simulation result on the plasma density (right axis). The THz energy in (a) is normalized and the experimental data are overlapped for clarity (solid circles). (b) Recorded THz energy achieved at 12 different pump wavelengths ranging from 0.8 to 2.02 µm (solid circles). The red solid curve shows the power law fit (λ4.6±0.5) along with the 65% confidence bounds (red dashed curves). Figures reprinted with permission from Ref. [38], American Physical Society.
    (a) Normalized THz waveforms acquired with THz-ABCD detection scheme for 400-µJ pump laser energy at 1850, 1450, and 800 nm pump wavelengths (left to right, shifted in time for clarity). (b) Power spectra of the THz waves in (a) (800 nm dashed, 1450 nm dotted-dashed, and 1850 nm solid). (c) THz beam profile recorded at the focus of the last parabolic mirror for 1850-nm pump wavelength with a THz camera. The overlay in (c) shows the Gaussian fit for the THz spot size at the focus of the last parabolic mirror. Figures reprinted with permission from Ref. [38], American Physical Society.
    Fig. 32. (a) Normalized THz waveforms acquired with THz-ABCD detection scheme for 400-µJ pump laser energy at 1850, 1450, and 800 nm pump wavelengths (left to right, shifted in time for clarity). (b) Power spectra of the THz waves in (a) (800 nm dashed, 1450 nm dotted-dashed, and 1850 nm solid). (c) THz beam profile recorded at the focus of the last parabolic mirror for 1850-nm pump wavelength with a THz camera. The overlay in (c) shows the Gaussian fit for the THz spot size at the focus of the last parabolic mirror. Figures reprinted with permission from Ref. [38], American Physical Society.
    Schematic of the experimental setup used to collect the backward THz radiation from two-color laser-induced gas plasma filament.
    Fig. 33. Schematic of the experimental setup used to collect the backward THz radiation from two-color laser-induced gas plasma filament.
    (a) Waveform and spectrum (inset) of the backward THz radiation from two-color laser-induced plasma filament. The effective focal length of the pump lens is 100 mm, and the total pump pulse energy is ∼480 μJ with pulse duration of ∼100 fs at 800 nm. (b) Normalized THz waveforms at different pump pulse energies, showing a temporal shift of the THz wave peaks in the time domain as the pump intensity changes due to the self-focusing/defocusing effects in gaseous media. The dashed lines in orange are theoretical fits.
    Fig. 34. (a) Waveform and spectrum (inset) of the backward THz radiation from two-color laser-induced plasma filament. The effective focal length of the pump lens is 100 mm, and the total pump pulse energy is ∼480 μJ with pulse duration of 100fs at 800 nm. (b) Normalized THz waveforms at different pump pulse energies, showing a temporal shift of the THz wave peaks in the time domain as the pump intensity changes due to the self-focusing/defocusing effects in gaseous media. The dashed lines in orange are theoretical fits.
    (a) Schematic illustration of the experimental setup for stand-off THz wave generation from two-color laser-induced air plasma. PC, phase compensator used to pre-compensate the temporal walk-off between ω and 2ω laser pulses; M1, M2 convex and concave mirrors, respectively, used to expand and focus the laser pulses to create plasma at stand-off distances. (b) Schematic diagram of the interferometric phase compensator (PC). DM, dichroic mirror used to reflect the 2ω pulse and transmit the ω laser pulses. HWP, half-wave plate at 2ω used to rotate the polarization of the 2ω pulse. (c) Phase scan obtained by scanning the relative phase between ω and 2ω laser pulses while monitoring at the peak THz electric field using EO sampling with 1-mm ZnTe crystal. The inset is a zoomed-in portion of the phase scan, showing a very high dynamic range.
    Fig. 35. (a) Schematic illustration of the experimental setup for stand-off THz wave generation from two-color laser-induced air plasma. PC, phase compensator used to pre-compensate the temporal walk-off between ω and 2ω laser pulses; M1, M2 convex and concave mirrors, respectively, used to expand and focus the laser pulses to create plasma at stand-off distances. (b) Schematic diagram of the interferometric phase compensator (PC). DM, dichroic mirror used to reflect the 2ω pulse and transmit the ω laser pulses. HWP, half-wave plate at 2ω used to rotate the polarization of the 2ω pulse. (c) Phase scan obtained by scanning the relative phase between ω and 2ω laser pulses while monitoring at the peak THz electric field using EO sampling with 1-mm ZnTe crystal. The inset is a zoomed-in portion of the phase scan, showing a very high dynamic range.
    THz waveforms generated at stand-off distances of (a) 6.5 m, (b) 10 m, and (c) 17 m. The total laser pulse energy is about 800 µJ. Figures reprinted with permission from Ref. [125], IEEE.
    Fig. 36. THz waveforms generated at stand-off distances of (a) 6.5 m, (b) 10 m, and (c) 17 m. The total laser pulse energy is about 800 µJ. Figures reprinted with permission from Ref. [125], IEEE.
    (a) Pictures of water lines with diameters of 0.2, 0.6, and 0.8 mm. (b) Industrial dispensing nozzles with different inner diameters. (c) Schematic of the water circulation system used to generate stable water lines.
    Fig. 37. (a) Pictures of water lines with diameters of 0.2, 0.6, and 0.8 mm. (b) Industrial dispensing nozzles with different inner diameters. (c) Schematic of the water circulation system used to generate stable water lines.
    (a) Typical experimental setup used to generate and detect THz waves from water films. ZnTe, 〈110〉 ZnTe crystal. The THz polarizer is optional. (b) Typical THz waveforms emitted from a liquid water film at the pump laser incident angles of ±65°. Inset: corresponding spectra of THz waveforms. Figure (b) reprinted with permission from Ref. [127], AIP Publishing.
    Fig. 38. (a) Typical experimental setup used to generate and detect THz waves from water films. ZnTe, 110 ZnTe crystal. The THz polarizer is optional. (b) Typical THz waveforms emitted from a liquid water film at the pump laser incident angles of ±65°. Inset: corresponding spectra of THz waveforms. Figure (b) reprinted with permission from Ref. [127], AIP Publishing.
    (a) THz amplitude as a function of pump pulse duration for a water line with a diameter of 0.20 mm. (b) Optimal pulse duration for water lines with different diameters. (c) Radiated THz waveforms from water lines with different diameters. (d) Corresponding Fourier transform spectra[133]. Figures reprinted from Ref. [133], Optica.
    Fig. 39. (a) THz amplitude as a function of pump pulse duration for a water line with a diameter of 0.20 mm. (b) Optimal pulse duration for water lines with different diameters. (c) Radiated THz waveforms from water lines with different diameters. (d) Corresponding Fourier transform spectra[133]. Figures reprinted from Ref. [133], Optica.
    (a) Dependences of THz energy and peak electron density on optical pulse duration for a 210-μm water line. (b) Optimal optical pulse duration versus the diameter of the water line[131]. Figures reprinted from Ref. [131], SPIE.
    Fig. 40. (a) Dependences of THz energy and peak electron density on optical pulse duration for a 210-μm water line. (b) Optimal optical pulse duration versus the diameter of the water line[131]. Figures reprinted from Ref. [131], SPIE.
    (a), (c) THz peak amplitudes as a function of x-positions for 200- and 260-μm-diameter water lines, respectively[130]. (b), (d) THz waveforms at x=±60 μm and x=±90 μm for 200- and 260-μm-diameter water line, respectively[131]. Figures (a) and (b) reprinted with permission from Ref. [130], American Physical Society. Figures (c) and (d) reprinted from Ref. [131], SPIE.
    Fig. 41. (a), (c) THz peak amplitudes as a function of x-positions for 200- and 260-μm-diameter water lines, respectively[130]. (b), (d) THz waveforms at x=±60μm and x=±90μm for 200- and 260-μm-diameter water line, respectively[131]. Figures (a) and (b) reprinted with permission from Ref. [130], American Physical Society. Figures (c) and (d) reprinted from Ref. [131], SPIE.
    (a) THz peak electric field (amplitude) as a function of x-position for water line diameters of 0.2, 0.3, 0.4, and 0.5 mm, respectively. (b)–(e) THz waveforms at the optimal x-positions for different diameter water lines[132]. Figures reprinted from Ref. [132], Optica.
    Fig. 42. (a) THz peak electric field (amplitude) as a function of x-position for water line diameters of 0.2, 0.3, 0.4, and 0.5 mm, respectively. (b)–(e) THz waveforms at the optimal x-positions for different diameter water lines[132]. Figures reprinted from Ref. [132], Optica.
    Optimal water line position as a function of the radius of the water line. Solid line: linear fitting of the experimental results.
    Fig. 43. Optimal water line position as a function of the radius of the water line. Solid line: linear fitting of the experimental results.
    Angular distributions of THz radiation from the water line when the laser focus is optimized for lateral detection (black squares) and set at the center of the water line (blue triangles). The red arrow points to the laser propagation direction.
    Fig. 44. Angular distributions of THz radiation from the water line when the laser focus is optimized for lateral detection (black squares) and set at the center of the water line (blue triangles). The red arrow points to the laser propagation direction.
    Dependence of THz energy/intensity on pump pulse energy for (a) water film[137] and (b), (c) liquid jet scheme[50,127]. (d) Dependence of the THz amplitude on pump pulse energy for 0.2-mm diameter water line[130]. Figures (a) and (b) reprinted with permission from Refs. [127,137], AIP Publishing. Figure (c) reprinted from Ref. [50], Optica. Figure (d) reprinted with permission from Ref. [130], American Physical Society.
    Fig. 45. Dependence of THz energy/intensity on pump pulse energy for (a) water film[137] and (b), (c) liquid jet scheme[50,127]. (d) Dependence of the THz amplitude on pump pulse energy for 0.2-mm diameter water line[130]. Figures (a) and (b) reprinted with permission from Refs. [127,137], AIP Publishing. Figure (c) reprinted from Ref. [50], Optica. Figure (d) reprinted with permission from Ref. [130], American Physical Society.
    (a) Normalized THz peak amplitude versus incident pump pulse energy: red dots represent experimental results when the water line position is optimized at a pump pulse energy of 0.4 mJ, and blue dots show the results when the water line position is optimized at 2.8 mJ. (b) Schematic illustration of the nonlinear focusing effect, indicating that the relative position between the water line and the laser focus varies as the pump pulse energy changes. (c) Blue triangles, THz amplitude versus pump pulse energy; red triangles, maximum blueshift of the pump pulse spectrum versus pump energy, showing that the saturation trends in THz amplitude and the maximum blueshift are consistent with each other. (d) Optimal lens position versus pump pulse energy: blue dots show experimental results, and the red line shows the theoretical fit of the experimental data using self-focusing effect. Figure (a) reprinted from Ref. [133], Optica.
    Fig. 46. (a) Normalized THz peak amplitude versus incident pump pulse energy: red dots represent experimental results when the water line position is optimized at a pump pulse energy of 0.4 mJ, and blue dots show the results when the water line position is optimized at 2.8 mJ. (b) Schematic illustration of the nonlinear focusing effect, indicating that the relative position between the water line and the laser focus varies as the pump pulse energy changes. (c) Blue triangles, THz amplitude versus pump pulse energy; red triangles, maximum blueshift of the pump pulse spectrum versus pump energy, showing that the saturation trends in THz amplitude and the maximum blueshift are consistent with each other. (d) Optimal lens position versus pump pulse energy: blue dots show experimental results, and the red line shows the theoretical fit of the experimental data using self-focusing effect. Figure (a) reprinted from Ref. [133], Optica.
    Pump pulse energy dependence of THz amplitude for water lines with 0.11-, 0.20-, and 0.39-mm diameters[133]. Figure reprinted from Ref. [133], Optica.
    Fig. 47. Pump pulse energy dependence of THz amplitude for water lines with 0.11-, 0.20-, and 0.39-mm diameters[133]. Figure reprinted from Ref. [133], Optica.
    A comparison between THz waveforms from water line (blue line) and two-color laser-induced air plasma (purple line).
    Fig. 48. A comparison between THz waveforms from water line (blue line) and two-color laser-induced air plasma (purple line).
    Schematic illustration of the experimental setup. An in-line phase compensator (IPC) is utilized to control the relative phase between the two-color laser pulses to synthesize asymmetric fields for maximal THz wave generation. DWP, dual-wavelength wave plate; PM, parabolic mirror with an effective focal length of 1-inch.
    Fig. 49. Schematic illustration of the experimental setup. An in-line phase compensator (IPC) is utilized to control the relative phase between the two-color laser pulses to synthesize asymmetric fields for maximal THz wave generation. DWP, dual-wavelength wave plate; PM, parabolic mirror with an effective focal length of 1-inch.
    Coherent control of THz radiation from a liquid water film. (a) Phase curve for THz radiation from the water film achieved by changing the relative phase between the two-color (ω and 2ω) laser pulses while monitoring the THz energy. (b) THz waveforms obtained by changing the relative phase between ω and 2ω pulses by π. Inset: peak THz electric field as a function of the phase delay between ω and 2ω pulses. Figures reprinted with permission from Ref. [145], AIP Publishing.
    Fig. 50. Coherent control of THz radiation from a liquid water film. (a) Phase curve for THz radiation from the water film achieved by changing the relative phase between the two-color (ω and 2ω) laser pulses while monitoring the THz energy. (b) THz waveforms obtained by changing the relative phase between ω and 2ω pulses by π. Inset: peak THz electric field as a function of the phase delay between ω and 2ω pulses. Figures reprinted with permission from Ref. [145], AIP Publishing.
    Normalized THz energy generated from the liquid water film versus total pump laser pulse (ω+2ω) energy. Blue square shows the THz energy calculated from the temporal integral of the THz waveform measured by means of EO sampling. Blue dot represents the modulated THz energy. Red circle indicates unmodulated THz energy measured. Dashed lines are fitting curves. The maximal pump pulse energy is limited by the breakdown of the free-flowing water film. Figure reprinted with permission from Ref. [145], AIP Publishing.
    Fig. 51. Normalized THz energy generated from the liquid water film versus total pump laser pulse (ω+2ω) energy. Blue square shows the THz energy calculated from the temporal integral of the THz waveform measured by means of EO sampling. Blue dot represents the modulated THz energy. Red circle indicates unmodulated THz energy measured. Dashed lines are fitting curves. The maximal pump pulse energy is limited by the breakdown of the free-flowing water film. Figure reprinted with permission from Ref. [145], AIP Publishing.
    Schematic illustration of the experimental scheme used to generate THz waves from liquid water pumped by double pulses. Δτ is the time delay between the two pump pulses.
    Fig. 52. Schematic illustration of the experimental scheme used to generate THz waves from liquid water pumped by double pulses. Δτ is the time delay between the two pump pulses.
    (a) Experimental results on the pump–probe measurement. The peak timing of the trace of SHG intensity autocorrelation between the pre- and main pumps defines the “zero delay” between the two laser pulses. (b) THz signals generated either by the p-polarized pre-pump or main pump individually are plotted as the top and middle lines. The bottom line shows the THz waveform generated by two pulses with a time delay Δτ=3.9 ps. (c) Similar results are plotted when the pre-pump is s-polarized at a time delay Δτ=6.8 ps. Obviously, the enhancement is higher than that shown in (b). All THz waveforms are normalized to peak THz electric field obtained by the p-polarized main pump solely. Figures reprinted with permission from Ref. [137], AIP Publishing.
    Fig. 53. (a) Experimental results on the pump–probe measurement. The peak timing of the trace of SHG intensity autocorrelation between the pre- and main pumps defines the “zero delay” between the two laser pulses. (b) THz signals generated either by the p-polarized pre-pump or main pump individually are plotted as the top and middle lines. The bottom line shows the THz waveform generated by two pulses with a time delay Δτ=3.9ps. (c) Similar results are plotted when the pre-pump is s-polarized at a time delay Δτ=6.8ps. Obviously, the enhancement is higher than that shown in (b). All THz waveforms are normalized to peak THz electric field obtained by the p-polarized main pump solely. Figures reprinted with permission from Ref. [137], AIP Publishing.
    (a) Dependence of THz energy on the water line position along the x direction measured at 90°. Vertical dashed lines represent the boundary of the water line. (b) Schematic of THz wave propagation in the water line. (c) Variation of the measured THz waveform as the water line position changes. (d) Fourier transform spectra of THz waveforms measured at different water line positions along the x direction[134]. Figures reprinted with permission from Ref. [134], AIP Publishing.
    Fig. 54. (a) Dependence of THz energy on the water line position along the x direction measured at 90°. Vertical dashed lines represent the boundary of the water line. (b) Schematic of THz wave propagation in the water line. (c) Variation of the measured THz waveform as the water line position changes. (d) Fourier transform spectra of THz waveforms measured at different water line positions along the x direction[134]. Figures reprinted with permission from Ref. [134], AIP Publishing.
    Dependence of THz wave electric field on (a) x- and (c) z-positions of water line. The color bar represents the THz wave amplitude. Corresponding THz energy dependence on (b) x- and (d) z-positions of water line[136]. Figures reprinted with permission from Ref. [136], IEEE.
    Fig. 55. Dependence of THz wave electric field on (a) x- and (c) z-positions of water line. The color bar represents the THz wave amplitude. Corresponding THz energy dependence on (b) x- and (d) z-positions of water line[136]. Figures reprinted with permission from Ref. [136], IEEE.
    Dependence of THz energy (normalized to the maximal value for each curve) on the displacement of water lines with different diameters when THz radiation is measured at a detection angle of 90°. X and R represent displacement along the x direction and the radius of the water line, respectively[134]. Figures reprinted with permission from Ref. [134], AIP Publishing.
    Fig. 56. Dependence of THz energy (normalized to the maximal value for each curve) on the displacement of water lines with different diameters when THz radiation is measured at a detection angle of 90°. X and R represent displacement along the x direction and the radius of the water line, respectively[134]. Figures reprinted with permission from Ref. [134], AIP Publishing.
    (a)–(e) Electric field emission patterns of the dipole array of lengths L≪λ, L=λ/3, 2λ/3, λ, and 4λ/3, respectively, obtained by numerical simulation. The transparent cylindrical column in (a) represents the position of the water line flowing along the y axis.
    Fig. 57. (a)–(e) Electric field emission patterns of the dipole array of lengths Lλ, L=λ/3, 2λ/3, λ, and 4λ/3, respectively, obtained by numerical simulation. The transparent cylindrical column in (a) represents the position of the water line flowing along the y axis.
    (a) Experimental setup for increasing the coupling efficiency and reducing the saturation effect. PM, parabolic mirror; Si, high-resistivity float-zone silicon wafer; EOS, electro-optic sampling. (b) Side and (c) top views of the laser beam focused by a cylindrical lens pair. F1, F2, EFLs of L1 or L2, respectively; Δz, distance between the geometrical focal planes of L1 and L2.
    Fig. 58. (a) Experimental setup for increasing the coupling efficiency and reducing the saturation effect. PM, parabolic mirror; Si, high-resistivity float-zone silicon wafer; EOS, electro-optic sampling. (b) Side and (c) top views of the laser beam focused by a cylindrical lens pair. F1, F2, EFLs of L1 or L2, respectively; Δz, distance between the geometrical focal planes of L1 and L2.
    (a) Dependence of the emitted THz energy on the laser pulse energy as a laser beam is focused by S-lens with different NAs. (b) Waveforms of THz radiation when the pump laser beam is focused by 2-in. EFL S-lens and 2-in. + 4-in. EFL C-lens pair, for comparison. (c) Dependence of the emitted THz energy on the laser pulse energy as Δz is optimized at 1.7 and 0.2 mJ, showing significant discrepancy. (d) Optimized Δz as a function of laser pulse energy. (e) Dependence of the THz energy on the laser pulse energy in the case of 2-in. EFL S-lens, 2-in. + 4-in. EFL C-lens pair, or 1-in. +2-in. EFL C-lens pair. (f) Normalized optical-to-THz efficiency as a function of laser pulse energy using different focusing schemes. Figures reprinted from Ref. [147], Optica.
    Fig. 59. (a) Dependence of the emitted THz energy on the laser pulse energy as a laser beam is focused by S-lens with different NAs. (b) Waveforms of THz radiation when the pump laser beam is focused by 2-in. EFL S-lens and 2-in. + 4-in. EFL C-lens pair, for comparison. (c) Dependence of the emitted THz energy on the laser pulse energy as Δz is optimized at 1.7 and 0.2 mJ, showing significant discrepancy. (d) Optimized Δz as a function of laser pulse energy. (e) Dependence of the THz energy on the laser pulse energy in the case of 2-in. EFL S-lens, 2-in. + 4-in. EFL C-lens pair, or 1-in. +2-in. EFL C-lens pair. (f) Normalized optical-to-THz efficiency as a function of laser pulse energy using different focusing schemes. Figures reprinted from Ref. [147], Optica.
    Peak THz amplitudes generated from plasma in (a) water line and (b) air as the C-lens pair rotates around the laser axis, verifying that in both air and liquid water, the ponderomotive-force-induced dipole emission pattern can be reshaped and reoriented by plasma reshaping. Figures reprinted from Ref. [147], Optica.
    Fig. 60. Peak THz amplitudes generated from plasma in (a) water line and (b) air as the C-lens pair rotates around the laser axis, verifying that in both air and liquid water, the ponderomotive-force-induced dipole emission pattern can be reshaped and reoriented by plasma reshaping. Figures reprinted from Ref. [147], Optica.
    Coherent detection of broadband THz waves with laser-induced plasma in liquid water. (a) Schematic of the experimental setup. A fundamental beam at 800 nm is focused through a BBO crystal to generate a controllable second-harmonic (CSH) at 400 nm, and a THz pulse is focused into a water film to generate THz-field-induced second-harmonic (TFISH) by mixing the THz pulse and the fundamental beam in the water film. Both TFISHs with CSH signals are collected and detected by the PMT. (b) Measured total second-harmonic (SH) signal as a function of the time delay between the THz wave and optical probe beam, in comparison with the THz waveform measured with EO sampling with a 0.1-mm GaP crystal, indicating that the measured time-resolved SH signal is consistent with the THz waveform measured by EO sampling with 0.1-mm GaP. (c) Fourier transform spectra of the time-resolved SH signal and the THz waveform obtained with EO sampling, for comparison. Figures reprinted with permission from Ref. [49], American Physical Society.
    Fig. 61. Coherent detection of broadband THz waves with laser-induced plasma in liquid water. (a) Schematic of the experimental setup. A fundamental beam at 800 nm is focused through a BBO crystal to generate a controllable second-harmonic (CSH) at 400 nm, and a THz pulse is focused into a water film to generate THz-field-induced second-harmonic (TFISH) by mixing the THz pulse and the fundamental beam in the water film. Both TFISHs with CSH signals are collected and detected by the PMT. (b) Measured total second-harmonic (SH) signal as a function of the time delay between the THz wave and optical probe beam, in comparison with the THz waveform measured with EO sampling with a 0.1-mm GaP crystal, indicating that the measured time-resolved SH signal is consistent with the THz waveform measured by EO sampling with 0.1-mm GaP. (c) Fourier transform spectra of the time-resolved SH signal and the THz waveform obtained with EO sampling, for comparison. Figures reprinted with permission from Ref. [49], American Physical Society.
    MaterialsElectric Field (MV/cm)Bandwidth (THz)Energy (mJ)Efficiency (‰)
    Gas plasma filaments[123]100200.18523.6
    Liquid plasmas (single color)[155]0.0231×1050.06
    Lithium niobate crystal[150]7.50.513.912
    Organic crystals[151,152]42100.930
    GaSe crystal[153,154]108200.01938
    Table 1. Comparison of Advanced THz Sources
    Yuxuan Chen, Yuhang He, Liyuan Liu, Zhen Tian, Xi-Cheng Zhang, Jianming Dai. Plasma-based terahertz wave photonics in gas and liquid phases[J]. Photonics Insights, 2023, 2(3): R06
    Download Citation